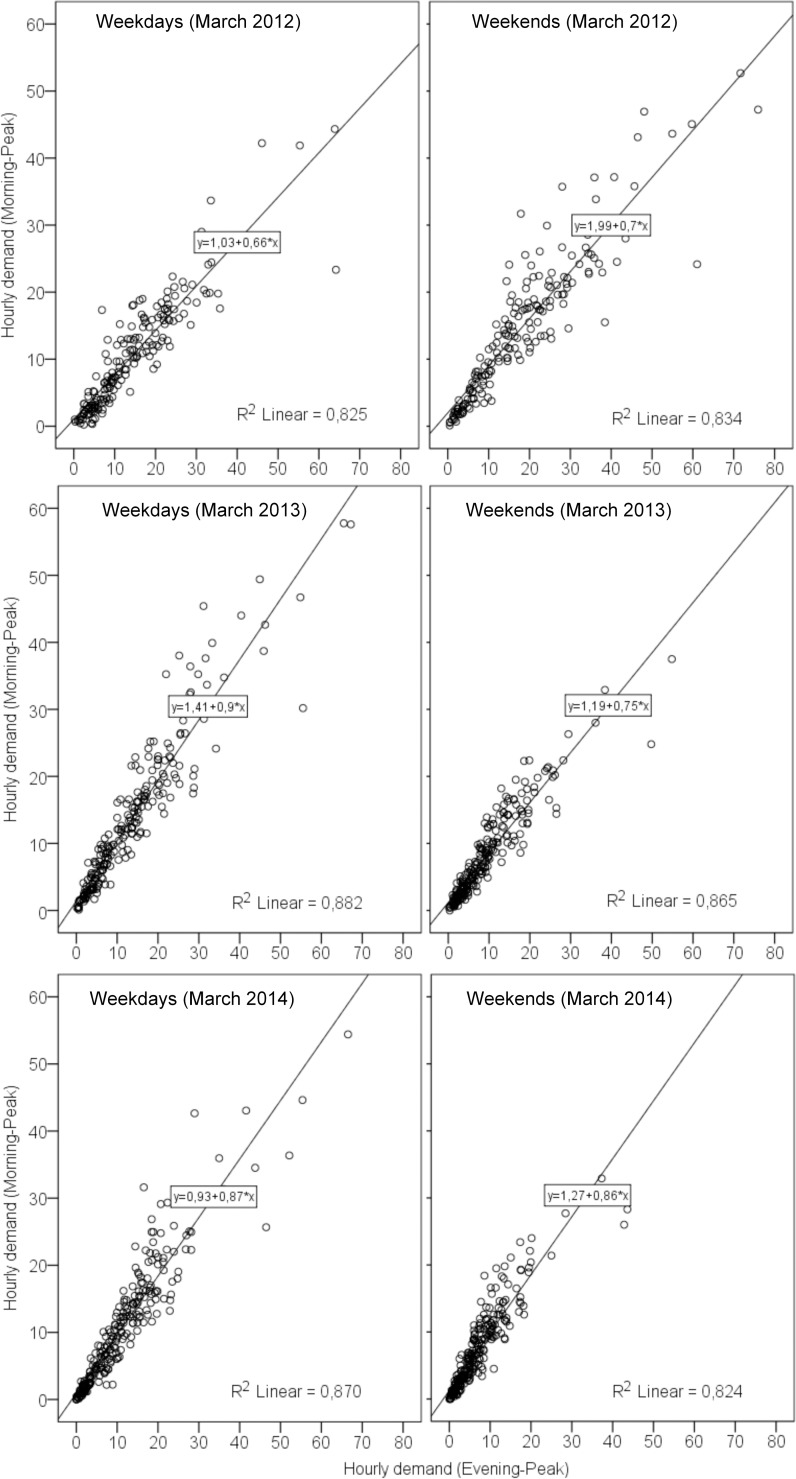
Fig 4. Comparisons of hourly demand during morning peak and evening peak hours at stations.
(1) the points represent each of bike stations. (2)Y axis represents the average number of hourly demand during morning peak hours, and X axis represents the average number of hourly demand during evening peak hours.

