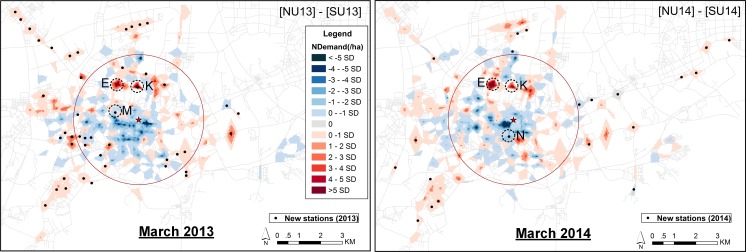
Fig 11. Differences in spatial demand between new users and steady users after system expansion (weekdays).
The “NDemand” represents the difference in normalized demand between new users and steady users. The left panel represents the comparison between new users and steady users in March 2013. The right panel represents the comparison between new users and steady users in March 2014.

