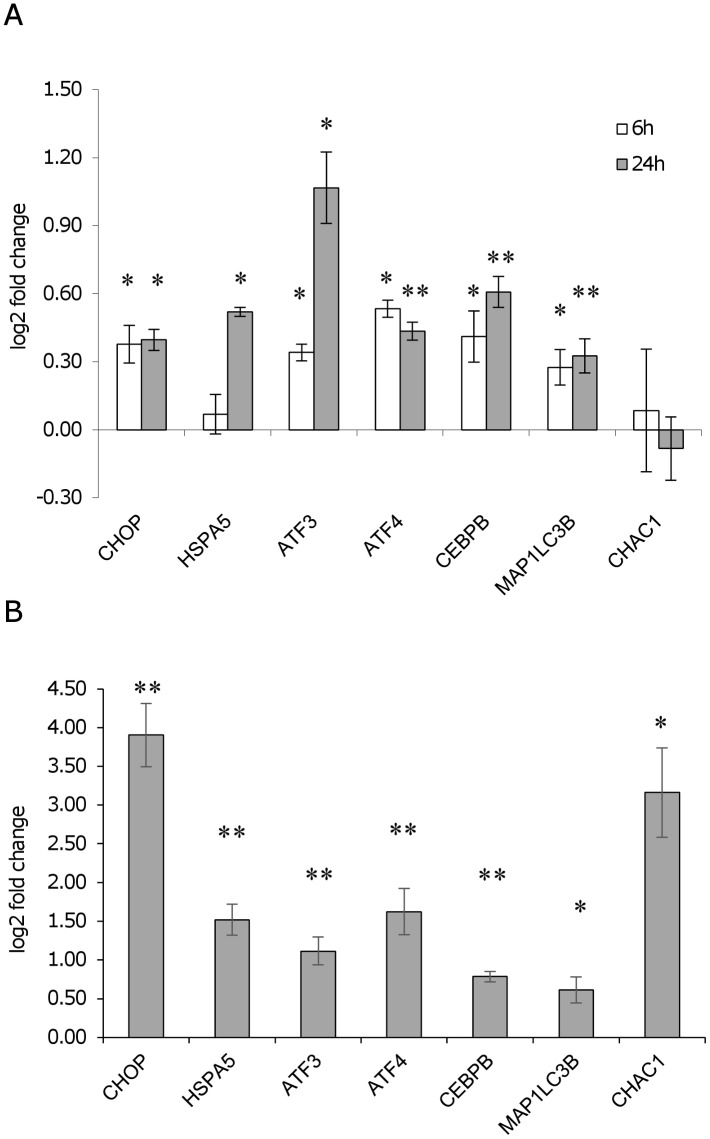
Fig 4. ER stress expression markers in infected U937-derived macrophages.
A) Gene expression profiling in U937-derived macrophages 6 h and 24 h after infection with L. infantum. The graph shows the log2 fold changes in comparison to the control (non-infected). B) Gene expression in U937-derived macrophages following tunicamycin treatment (0.5 μg/ml, 6 h). The graph shows the log2 fold changes in comparison to the control (DMSO) values. Data are represented as the mean ± SEM of at least three experiments. * p < 0.05, ** p < 0.01.

