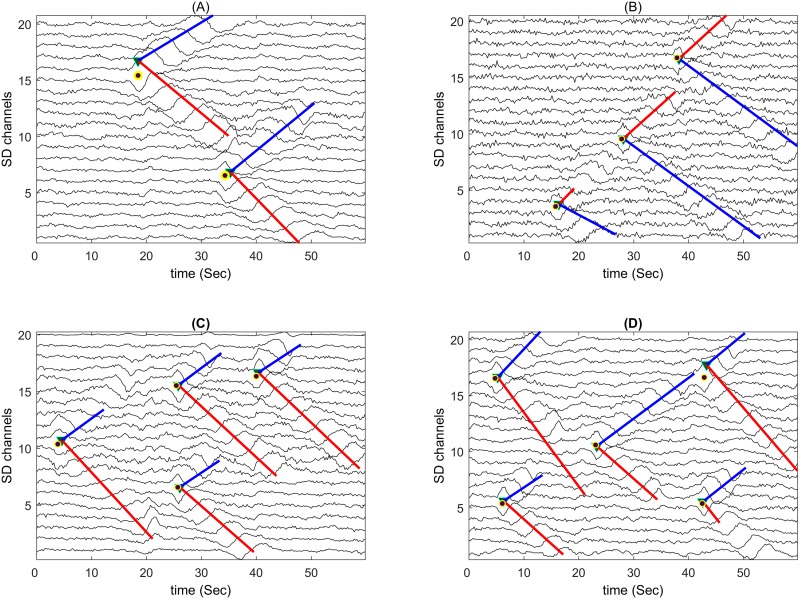
Fig 8. Examples of the simulated sEMG signals with 20 Single Differential (SD) channels and 60-ms epochs.
The image frames A to D contained 2 IZs (-5 dB SNR), 3 IZs (0 dB), 4 IZs (5 dB) and 5 IZs (10 dB), respectively. The location of the simulated IZs is shown by circles. The developed program automatically identified the location of IZs as the crossing of the ‘v’ shape propagation lines (upper lines in blue and lower lines in red color). The CV of the identified propagation pattern was then estimated by the proposed algorithm.

