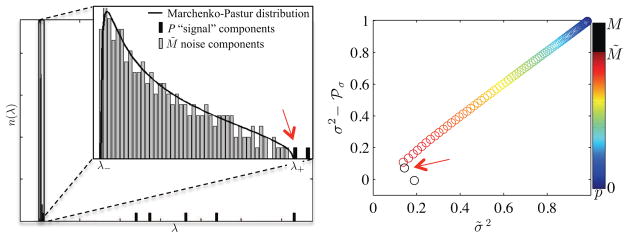
Figure 1.
(left) The upper edge λ+ of the Marchenko-Pastur distribution, a universal signature of noise in sample covariance matrices, distinguishes between noise- and significant signal-carrying principal components. (right) Validitiy of Eq. [8] as function of p nullified eigenvalues (color encoding). if p > M̃, suppressed signal leaks into the residuals and, as such, the variability of the residual map, σ̃2, start to deviate from σ2 − ℘σ with σ2 being the noise variance and ℘σ the noise variance accumulated in the p omitted eignvalues. Simulated data (cf. Data) with M = 90 and N = 250 was used to generate the graphs.

