
Figure 3.
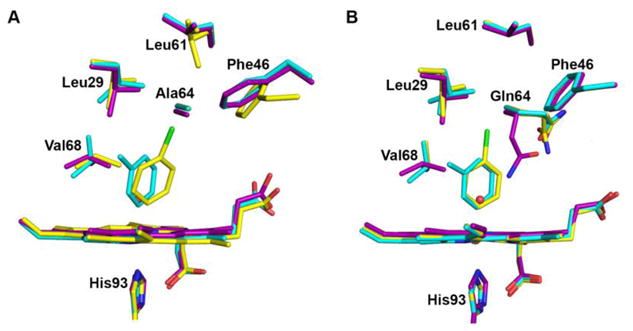
Heme site comparisons between the mutant metMb and product complexes. A) metMb H64A–H2O (purple), H64A–tolyl-m (cyan) and H64A–chlorophenyl-p (yellow). B) metMb H64Q–H2O (purple), H64Q–tolyl-m (cyan) and H64Q–chlorophenyl-p (yellow). The relative heme and amino acid residue positions were determined from Cα chain superpositions.