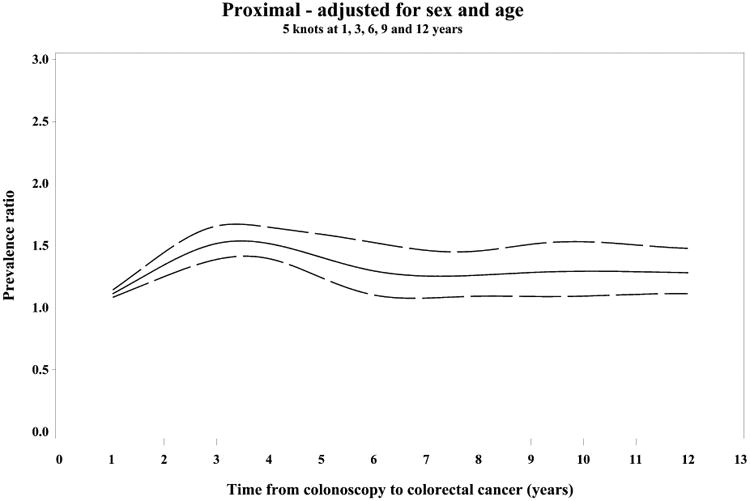
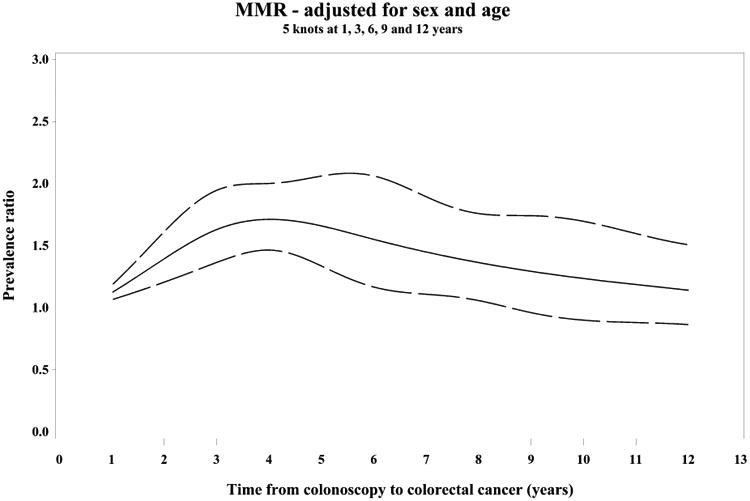
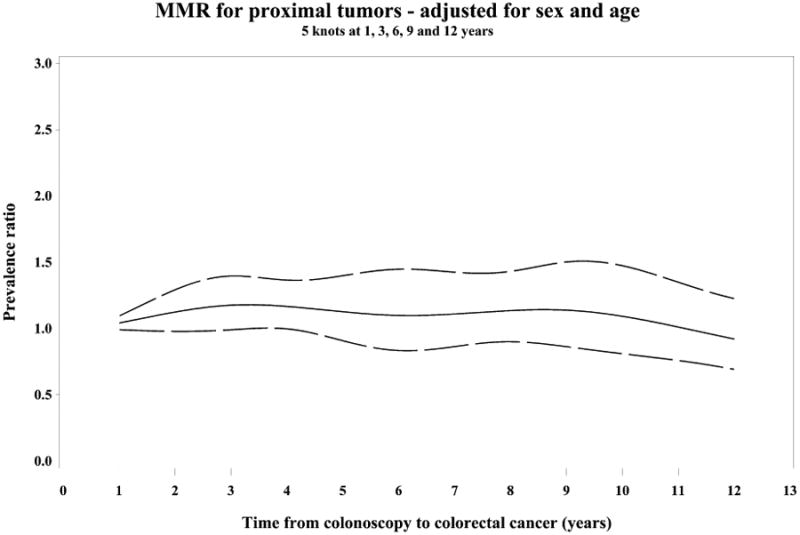
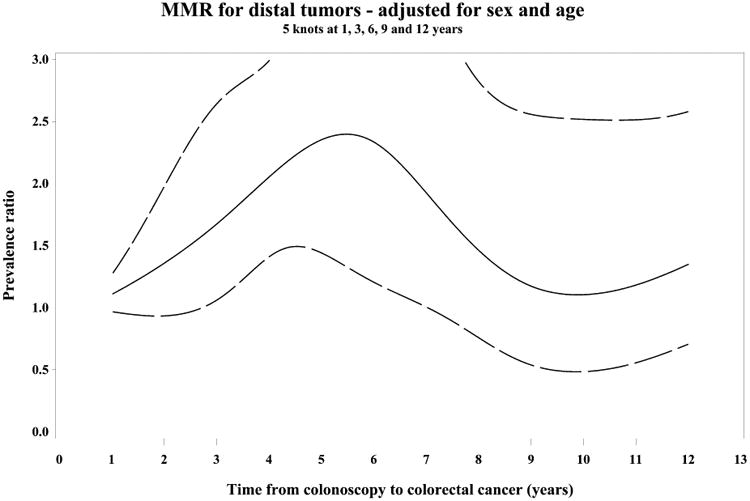
Figure 2.


Restricted cubic spline analyses showing variation in the PC/DC prevalence ratio (PR) of patient and tumor characteristics over time since prior colonoscopy, adjusted for sex and age (PR= solid line, 95% CI=dashed lines)
(A) PR of proximal tumor location, (B) PR of mismatch repair deficiency (MMR)
PR of MMR stratified by tumor location proximal (C) and distal (D)
Splines have 5 knots at 1, 3, 6, 9 and 12 years.
