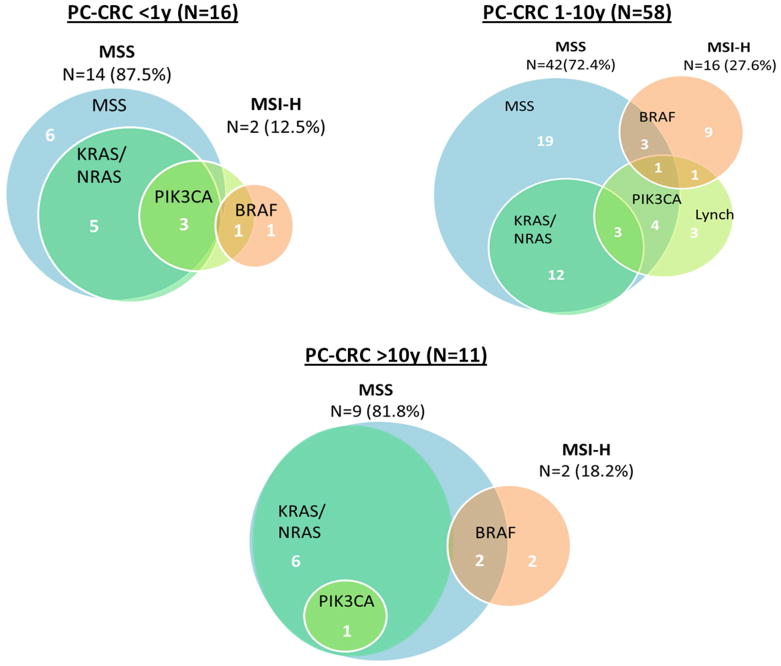
Figure 3.

Distribution of molecular characteristics among hospital-based PC cases, by interval between colonoscopy and CRC diagnosis (n=85).
Note: Figures are not proportional between time intervals.
Area exterior to MSS circle represents MSI-high tumors.
