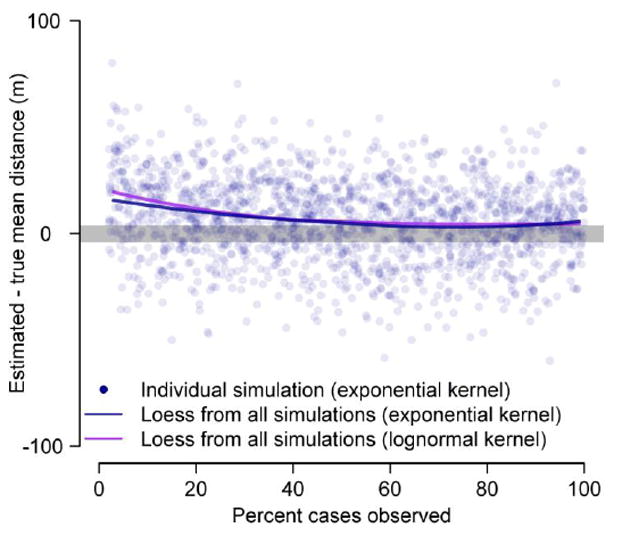
Figure 4.

Estimates of mean transmission distance from simulated transmission chains where only a subset of cases are observed. The blue dots represent estimates from individual simulations with an exponential distributed transmission kernel. The lines represent loess curves from 2000 simulations.
