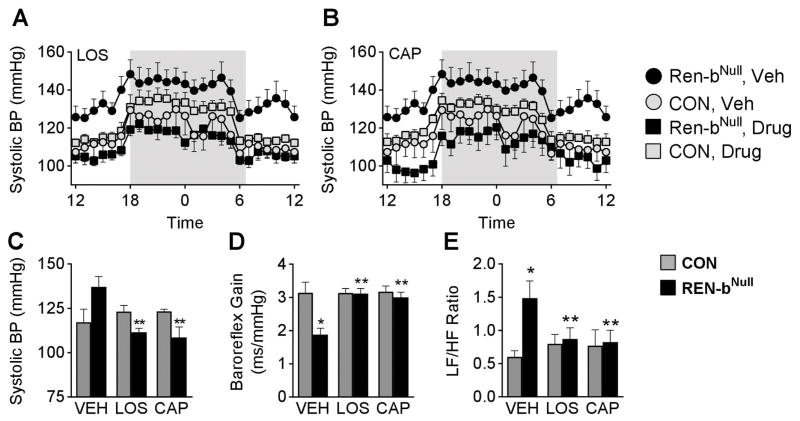
Figure 5. Activation of the Brain RAS.
(A–B) Effect of chronic RAS inhibition in response to i.c.v. losartan (LOS, A) and i.c.v. captopril (CAP, B) on BP. BP was measured by radiotelemetry and is plotted hourly (A–B). Shaded area reflects the dark cycle. Sample size was 5 control vehicle, 6 control LOS, 5 control CAP, 7 renin-bNull vehicle, 6 renin-bNull LOS, 6 renin-bNull CAP. Note that the vehicle groups in A and B are the same and were repeated for clarity and easy comparison. (C–E) Summary data of 24 hour systolic BP (C), baroreflex gain (D) and spectral analysis (E). *P < 0.05 vs. control. **P < 0.05 vs. vehicle.

