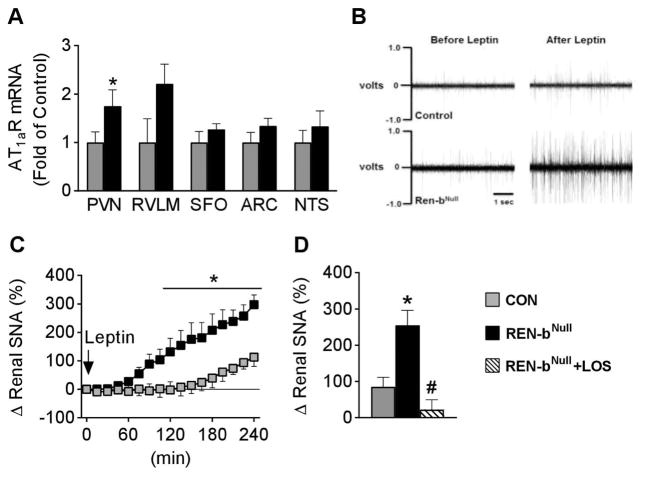
Figure 6. Role of AT1 Receptors.
(A) AT1aR mRNA expression in PVN (n=10 per group), RVLM (n=10 control, n=9 renin-bNull), SFO (n=10 per group), ARC (n=9 per group) and NTS (n=9 control, n=10 renin-bNull). *, P< 0.05 vs control. (B) Representative tracings of RSNA in chloralose-anesthetized mice before and during the 4th hour following i.c.v. administration of leptin (5 μg). (C–D) Renal sympathetic nerve activity (SNA) response to i.c.v. injection of leptin. Percent changes in renal SNA for 4 hours after i.c.v. leptin are plotted and the last 60 minutes are summarized (control n=10, renin-bNull n=5, renin-bNull + i.c.v. losartan n=5). *, P<0.05 vs control; #, P<0.05 vs renin-bNull without losartan.

