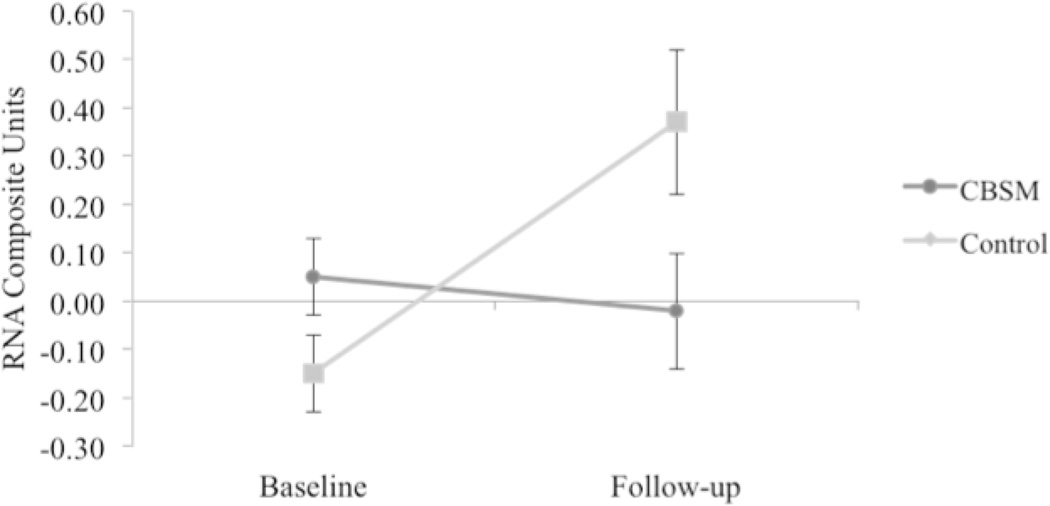
Figure 2.
Group differences in pre- and post-intervention mean CTRA gene expression (N = 51); Adjusted mean CTRA gene expression is depicted controlling for age, disease stage, treatment with chemotherapy, radiation therapy, endocrine therapy, and follow-up time (6 or 12-months). Error bars reflect standard error.

