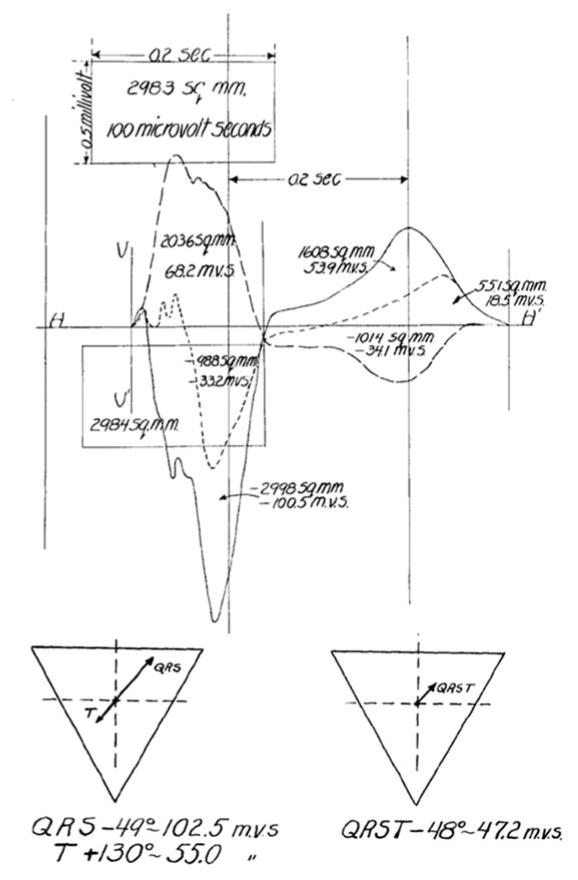
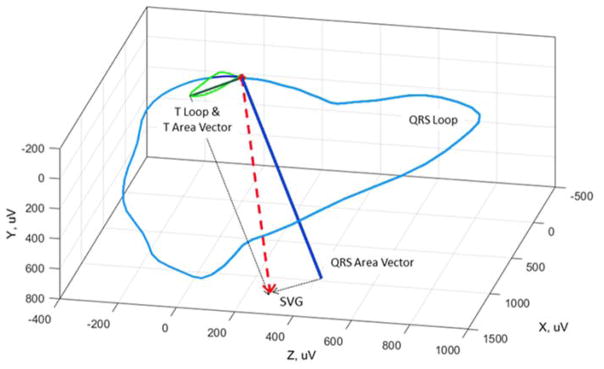
Figure 1.
A. Manual calculation of the ventricular gradient in the frontal plane by Wilson et al. [1] The area of the QRS complex and T-wave in leads I, II, and III, were used to create vectors representing the mean electrical QRS axis, the mean electrical T-wave axis, and the ventricular gradient (the mean QRST axis/the vector sum of the mean QRS axis and mean T-wave axis). See text for details. Reproduced with permission from Wilson et al. [1] B. An example of the spatial ventricular gradient (SVG). The SVG is a vector (red) which is the sum of the mean QRS area vector (dark blue) and mean T-wave area vector (dark green).


