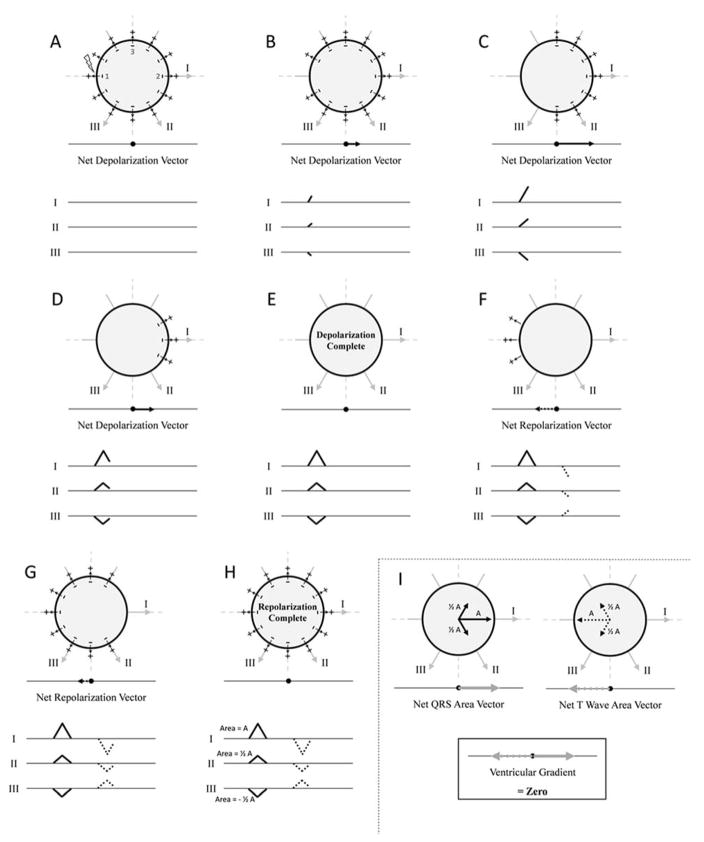
Figure 2.
Idealized example in which there is no ventricular gradient in a sphere of myocardium. If depolarization and repolarization occur in the same spatiotemporal order, there is no ventricular gradient. The orientation of leads I, II, and III are shown, as are the “electrocardiogram” tracings that would be observed in each lead. Panels A–E represent depolarization of an idealized sphere of myocardium. The myocardium is stimulated at point 1 and depolarization occurs from left to right inscribing “QRS complexes” in each lead. After a set amount of time, repolarization also begins at point 1 and also proceeds from left to right (panels F–H). The “QRS complex” and “T-wave” in each lead are therefore oriented in the opposite direction, with areas that are equal and opposite. Panel I summarizes the vector projections in each lead with vector magnitude proportional to the area of the QRS complex or T-wave in each lead. In this example, the “QRS” area and “T-wave” area vectors are equal in magnitude and opposite in direction. The vector sum of the “QRS” area and “T-wave” area vectors (the ventricular gradient) is therefore zero. See text for details. Figure adapted from Hurst [20].

