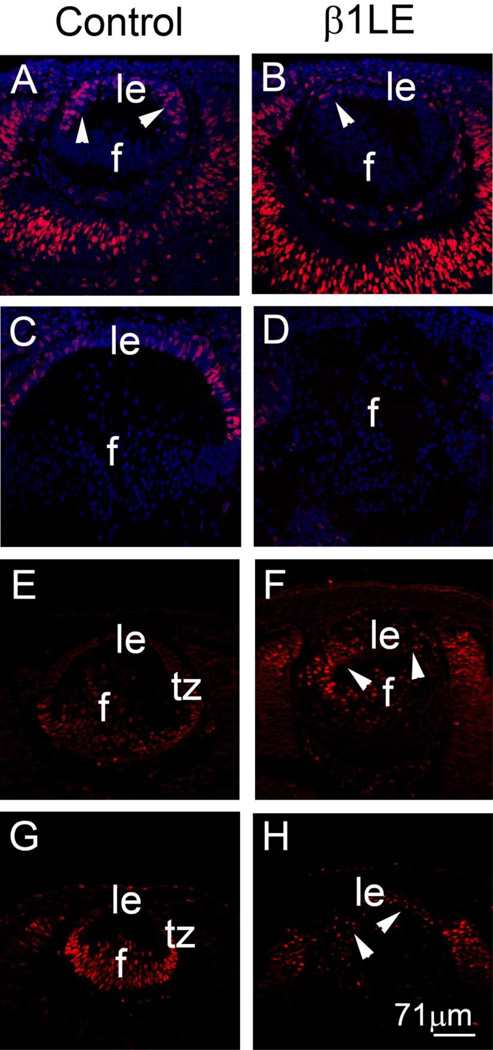
Figure 4. β1LE lenses exhibit decreased LEC proliferation coincident with the up regulation of cell cycle exit markers.
EdU cell proliferation assays (A–D) comparing control (A- E12.5; C-E13.5) with β1LE lenses (B- E12.5; D- E13.5). A decrease in the number of LECs actively synthesizing DNA is seen starting at E12.5 in β1LE lenses (B) as compared to controls (A). By E13.5, β1LE lenses (D) show complete loss of cells actively synthesizing DNA as compared to controls (C) which maintain cell proliferation in the lens epithelium. Confocal immunofluorescence showing the expression pattern of cell cycle exit markers in controls (E- p27Kip1 ; G- p57Kip2 ) versus β1LE lenses (F- p27Kip1 and H- p57Kip2). Control lenses show little to no p27Kip1 (E) as well as p57Kip2 (G) in LECs at E12.5, while β1LE lenses show large numbers of cells exiting the cell cycle as compared to controls, shown by both p27Kip1 (F- arrowheads) staining and p57Kip2 staining (H-arrowheads). . All staining was performed on a minimum of three biological replicates.
Red (panels A, B, C, D)- Sites of active DNA synthesis, (panels E, F)- p27Kip1, (panels G, H)-p57Kip2 ; Blue- DNA. Abbreviations: f - lens fiber cells, le, lens epithelium, tz - transition zone. Scale bar - 71µm.

