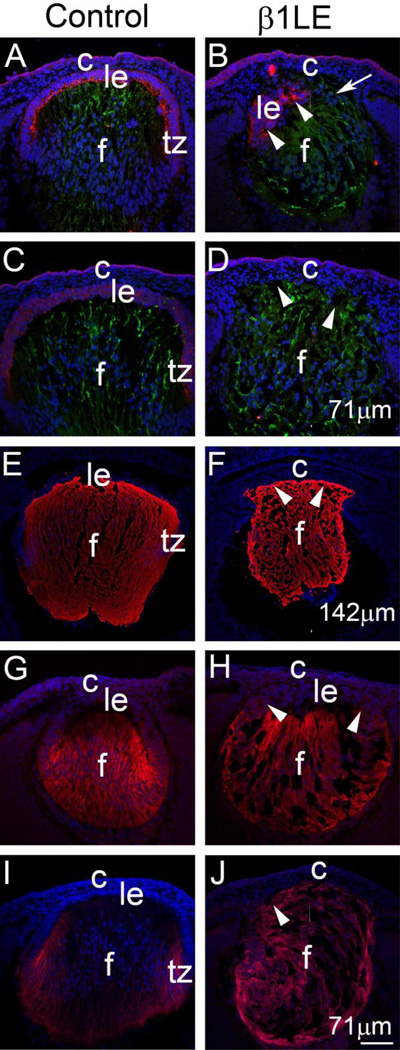
Figure 5. β1LE LECs down-regulate E-cadherin while exhibiting aberrant fiber cell marker staining.
Panels (A to D) show co-immunolocalization of E-cadherin (red) and γ-crystallin (green) at E13.5 (A,B) and E14.5 (C,D). Control E13.5 (A) lenses show staining for E-cadherin (red) only in anterior LECs, with γ-crystallin (green) restricted only to fiber cells. In contrast, β1LE lenses at E13.5 (B) show γ-crystallin staining extending up-to the cornea (arrow) in cells that exhibit cell nuclei on the anterior aspect of the lens. Only a few lens epithelial cells expressing E-cadherin (arrowheads) are still observed in this lens region. E14.5 control lenses (C) show uniform E-cadherin staining in the anterior LECs while γ-crystallin expression is confined to the lens fiber cells. In contrast, a complete loss of E-cadherin expression is seen in E14.5 β1LE lenses, with all lens cells positive for γ-crystallin (D - arrowheads). At E16.5, Aquaporin0 staining is restricted to lens fiber cells in control lenses (E), while β1LE lenses exhibit Aquaporin0 (F) staining in almost all lens cells (arrowheads). At E12.5 (G), Jagged1 levels up-regulate at the transition zone of control lenses, while β1LE lenses show an anterior shift in Jagged1 expression (H - arrowheads). At E13.5, Jagged1 is predominately located in the newly differentiated lens fibers of control lenses (I), whereas in β1LE lenses, all lens cells are positive for Jagged1 (J-arrowheads). All staining was performed on a minimum of three biological replicates.
Red (panels A–D) – E-Cadherin, (panels E–F)– Aquaporin0, (panels G-J)- Jagged1; Green (panels A–D)- γ-crystallin, Blue - DNA. Abbreviations: le – lens epithelium, c- cornea, f - lens fiber cells, tz – transition zone. Scale bar Panels A, B, C, D, G, H, I, J = 71 µm; Panels E, F =142µm.

