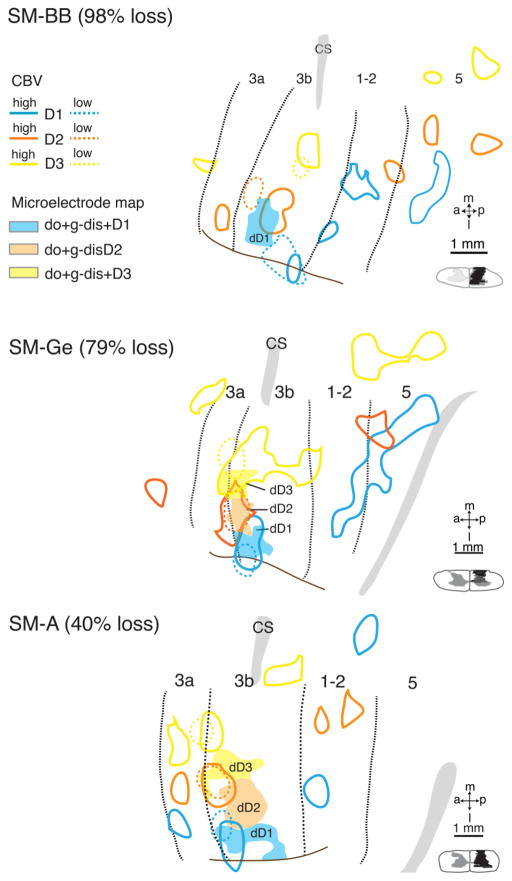
Figure 15.
Co-registrations of high and low intensity CBV maps with the electrophysiological maps for cases SM-BB (98% loss), SM-Ge (79% loss), and SM-A (40% loss). CBV maps collected with low intensity stimulation are in color-coded dashed outlines, CBV maps collected with high intensity stimulation are in color-coded solid outlines, and electrophysiological maps are in solid shades. Black dotted lines indicate areal borders based on architecture and electrophysiological results. Dashed lines mark rostral and caudal borders of hand region in area 3b; solid brown lines mark hand-face border in area 3b. Abbreviations, H, hand; Wr, wrist. Conventions follow Figure 1.

