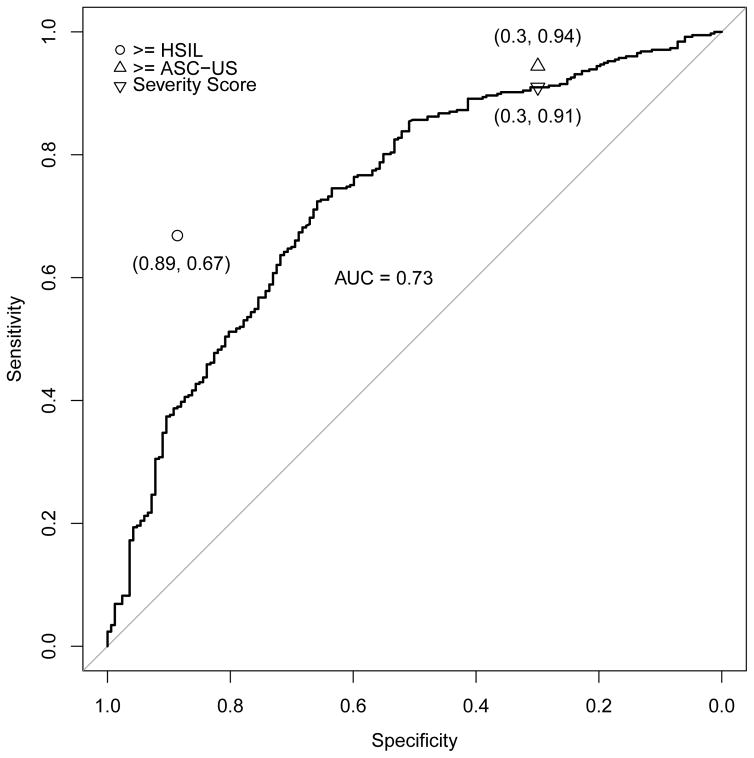
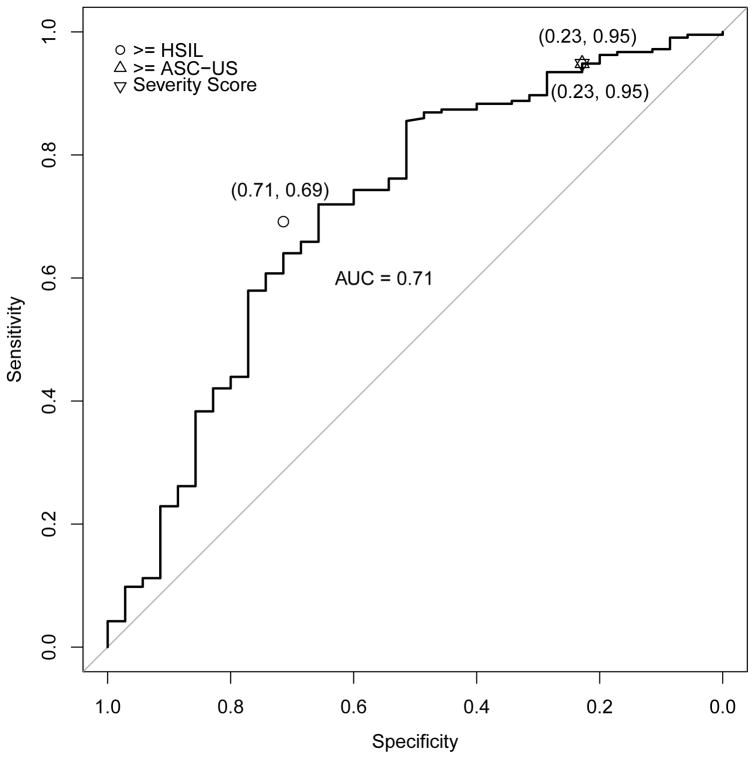
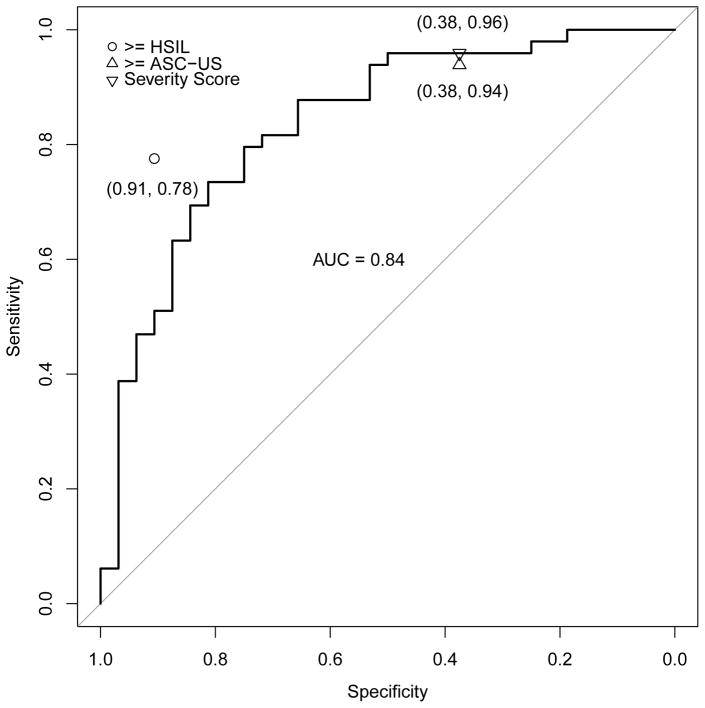
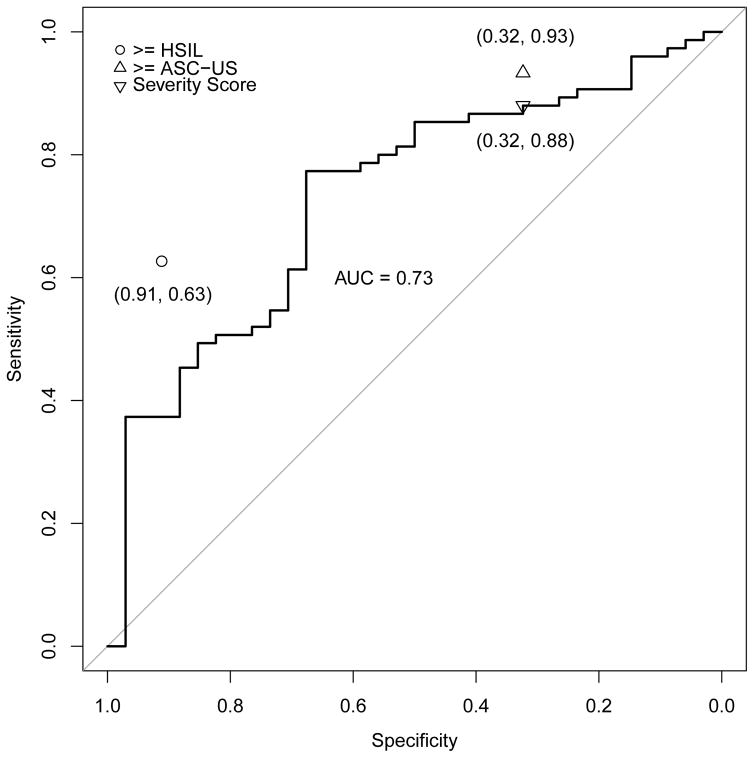
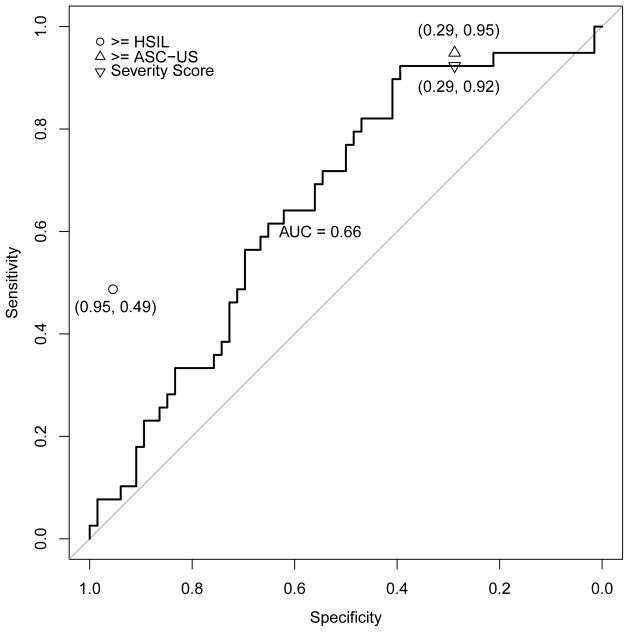
Figure 3.
ROC curve for severity score, with area under the curve (AUC with 95% confidence interval), and comparison of severity score cut-point to conventionally-read cytology (≥ASC-US, ≥HSIL) thresholds. Figure 3a. All high-risk HPV-positive, AUC = 0.73 (0.69, 0.78); Figure 3b. HPV16, AUC = 0.71 (0.61, 0.81); Figure 3c. HPV18/45, AUC = 0.84 (0.74, 0.93); Figure 3d. HPV31/33/52/58, AUC = 0.73 (0.63, 0.83); Figure 3e. HPV35/39/51/56/59/66/68, AUC = 0.66 (0.55, 0.77). The results indicate that in this referral population, the computer-generated severity score yielded discrimination of cases of ≥CIN2 versus non-cases with a combination of sensitivity and specificity similar to conventional cytologic results of ASC-US+ versus NILM. The inverted triangle is to denote the hypothetical choice of a cutpoint to simulate a standard reading of the ThinPrep cytology slide at an ASC-US threshold.

