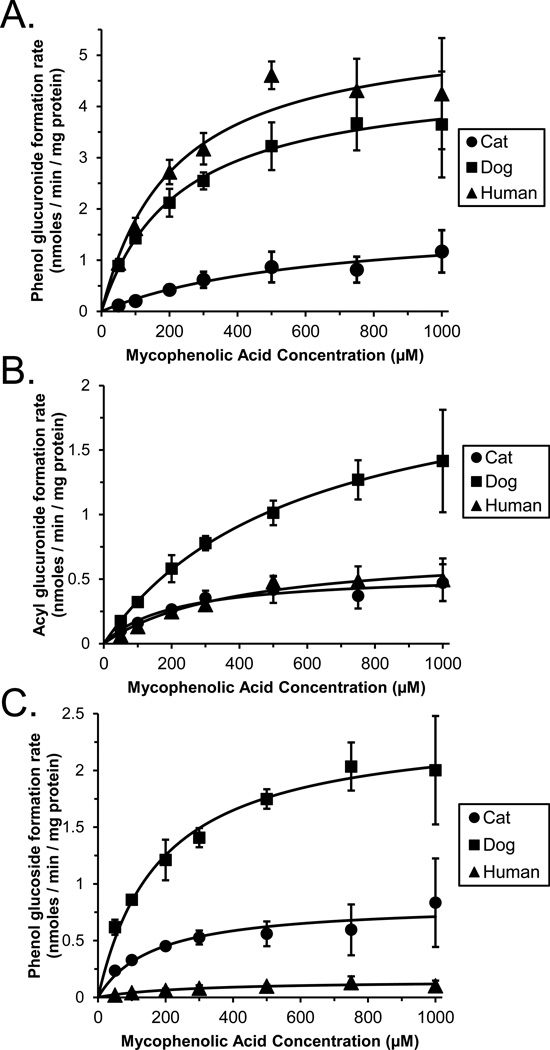
Figure 1.
Enzyme kinetic plots of mycophenolic acid (MPA) substrate concentration versus formation rates of MPA phenol glucuronide (panel A), acyl glucuronide (panel B), and phenol glucoside (panel C) measured using pooled liver microsomes from 16 cats (filled circles), 26 dogs (filled squares) and 48 human donors (filled triangles). Data points are the mean (± standard error) values of 3 independent experiments. Also shown are the fitted curves derived by non-linear regression using the Michaelis-Menten model.

