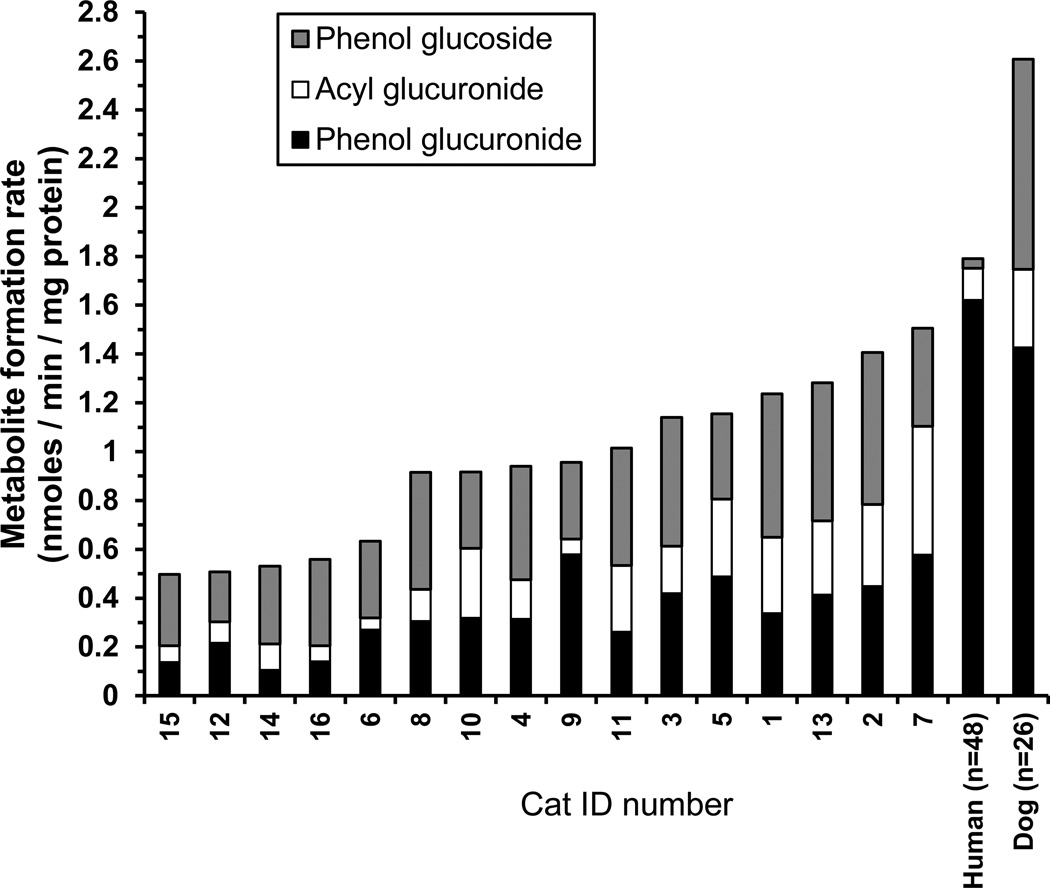
Figure 3.
Stacked bar chart showing the formation rates of mycophenolic acid (MPA) phenol glucuronide (black bars), acyl glucuronide (white bars), and phenol glucoside (gray bars) measured at 100 µM MPA concentration using microsomes prepared from 16 different domestic short hair cat livers in triplicate in 1 experiment. Individual sample results (identification (ID) numbers 1 to 16) were sorted from lowest to highest (left to right) total conjugation activity. Also shown for comparison are the same activities for pooled dog and human liver microsomes measured at the same MPA concentration. The mean values for the dog and human were derived from 3 experiments.

