Figure 3.
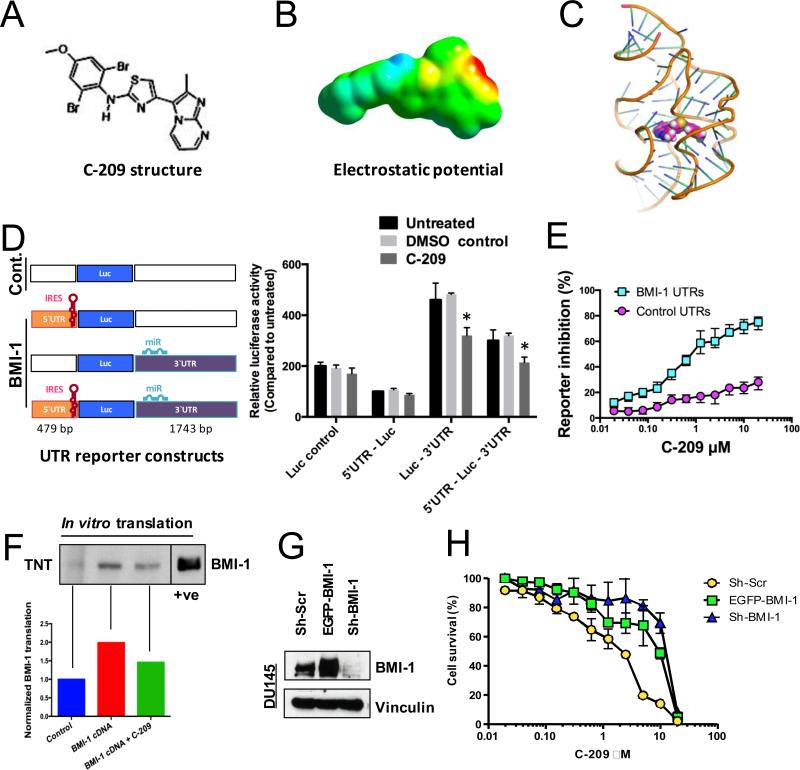
Modulation of BMI-1 post-transcriptional regulation by C-209. A, Chemical structure of C-209. B, The electrostatic potential of C-209 mapped to electron density surface. At an IC50 of 2μM, the electrostatic potential E(RB3LYP) = −1423.42386733 au and dipole moment = 9.4906 Debye. C, Docking of C-209 to the human BMI-1 RNA. View of C-209 (space filling model colored magenta) within the binding pocket of the BMI-1 5‘UTR model (ribbon). Illustration was created using the Pymol software package. D, Left, Schematic diagram of the luciferase (Luc) constructs used. The diagrams display the IRES containing 5‘UTR and the micro-RNA (miR) binding sites within the 3‘UTR. The base pair (bp) length of the human BMI-1 5` and 3‘UTRs are displayed (from full length cDNA # L.13689.1). Boxes and sites are drawn neither to scale nor to exact locations. Right, DU145 cells containing Luc flanked by control UTRs or BMI-1 5’ or 3’ UTR regions were treated for 24 hrs with 2μM C-209 and compared against untreated and DMSO controls. IRES-containing BMI-1 5‘UTR and 3‘UTR were shown to either inhibit or upregulate Luc expression, respectively (14). The 5‘UTR reduced Luc expression, while when combined with the 3‘UTR reversed the Luc expression enhancing effects of the 3‘UTR. Treatment with 2μM C-209 resulted in reduced Luc expression opposing the effects of the 3‘UTR. Data plotted represent six independent experiments. E, Percentage of inhibition of Luc reporter cells with either control (Cont.) vs. BMI-1 5‘ and 3‘UTR cells following C-209 (0.0195-20μM) treatments for 72hrs. F, Selective effects of C-209 on BMI-1 mRNA translation in cell-free extracts. Top, WB analysis of translated full-length BMI-1 RNA (complete cDNA including BMI-1 5‘ and 3‘UTRs) in in vitro transcription/translation (TNT) assays in eukaryotic cell-free rabbit reticulocytes. A cellular lysate in the left most lane was used as a positive control to determine the BMI-1 migrated band on the polyacrylamide gel at a position of ~37 KDa. Bottom, quantitation of normalized translated BMI-1 from BMI-1 cDNA pretreated or not with 2μM C-209 for one hour compared to control. G, BMI-1 expression in vector-transduced (Sh-Scr), BMI-1-overexpressing (EGFP-BMI-1) and BMI-1-depleted (shBMI-1) DU145 cells. H, Cell viability evaluated in vector-transduced (Sh-Scr), BMI-1-overexpressing (EGFP-BMI-1) and BMI-1-depleted (shBMI-1) DU145 cells following C-209 (0.0195-20μM) treatments for 72hrs.

