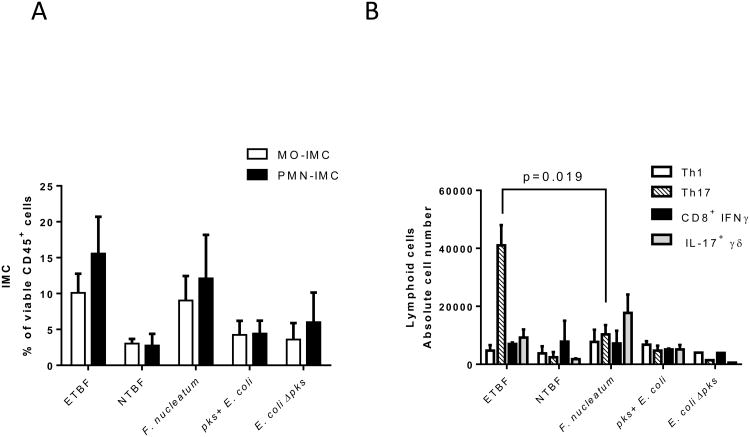
Figure 6. Mucosal immune response to Fusobacterium nucleatum, pks+ Escherichia coli, ETBF and NTBF colonization in WT mice.
A, Proportion of CD11b+Ly6ChiLy6G- MO-IMC (white bars) and CD11b+Ly6ClowLy6G+ PMN-IMC (black bars) as percent of viable CD45+ leukocytes isolated from distal colon of WT mice one week post-infection with oncogenic bacteria listed along the x-axis.
B, Absolute numbers of Th1 (CD3+CD4+IFNγ+), Th17 (CD3+CD4+IL-17+), cytotoxic T cells (CD3+CD8+IFNγ+) and γδ T cells (CD3+γδ+IL-17+) lymphoid populations isolated from distal colon as described in A.
A & B, Aggregate data of n=2 independent experiments with 3 mice per group.

