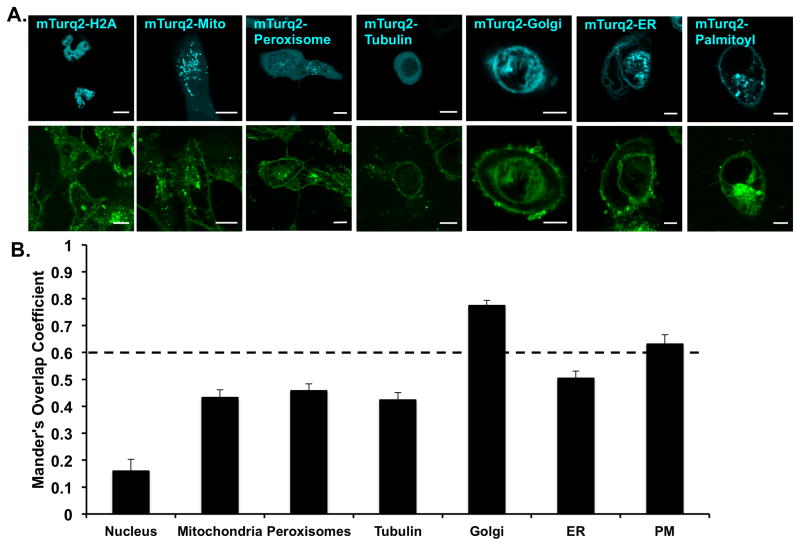
Figure 2. Cellular distribution of TopFluor-C1P in A549 cells.
A) A549 cells were transfected with mTurquiose2 organelle specific markers (cyan) to investigate the cellular distribution of TopFluor-C1P (green). 1 μM TopFluor-C1P was added to cells 1 hour prior to imaging. Representative images for the mTurquiose2 and TopFluor channels are shown for each cellular marker. Scale bar = 10 μm. B) Cellular images were analyzed for colocalization using Mander’s overlap coefficient. Significant colocalization is above 0.6 and data shown is ± standard error of the mean (SEM).

