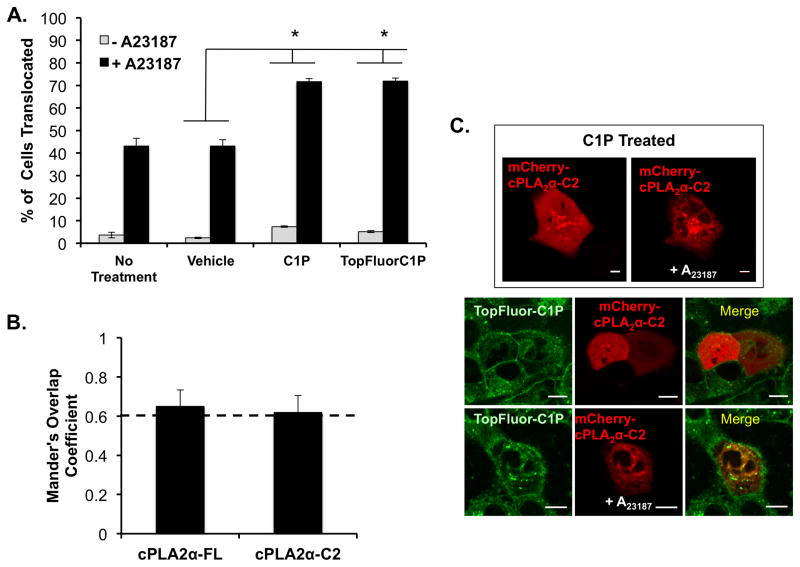
Figure 3. Translocation and colocalization of cPLA2α with C1P and TopFluor-C1P.
A) A549 cells expressing cPLA2α were assessed for translocation to intracellular membranes following treatment with or without the calcium ionophore A23187. In addition to A23187, cells were either treated with vehicle control, C1P, or TopFluor-C1P. The percentage of cells exhibiting cPLA2α translocation from the cytosol to the Golgi were counted. In three separate experiments, 20–70 cells were counted for each condition to display the average ± SEM. B) Colocalization analysis was performed for the entire cell image using TopFluor-C1P with both mCherry fusion constructs of full length and the isolated C2 domain of cPLA2α. C) Several representative images are displayed with the addition of 10 μM A23187 between C1P treated cells and TopFluor-C1P treated cells. The merged images display colocalization with TopFluor-C1P when A23187 is added to cells to promote binding and translocation of cPLA2α. Scale bar = 10 μm. * Indicates p <0.05 statistical significance.

