
FIGURE 6.
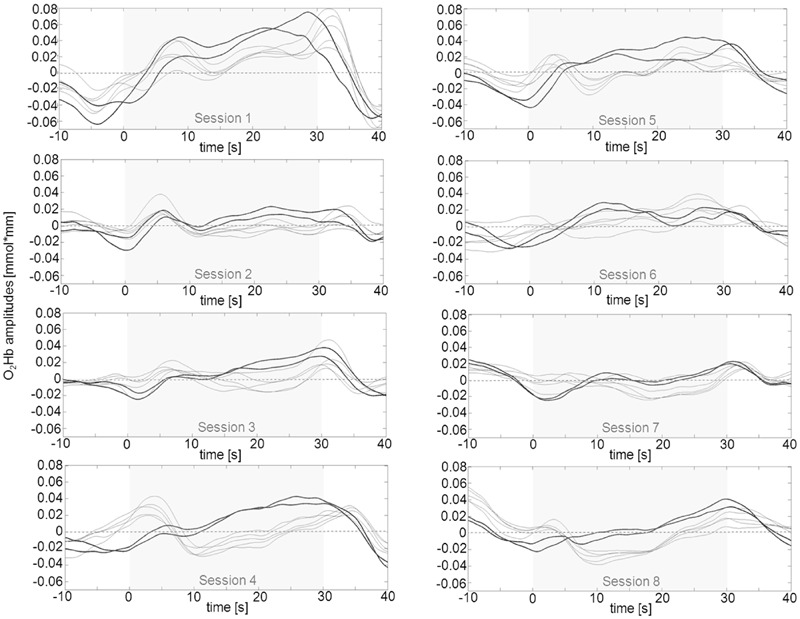
Qualitative data analysis of mean O2Hb amplitudes in left prefrontal channels over the course of eight NIRS based neurofeedback sessions in one exemplary participant (subject #6) out of two that were able to voluntarily up-regulate activity over the whole training course, but in only two neighboring prefrontal channels at a time (bold lines representing channels #8 and 9 for the first session, #4 and 9 for the second session and #4 and 8 for the remaining sessions). These pairs of channels exhibit more pronounced positive amplitudes as compared to the other frontal ROI channels. Changes in O2Hb concentration occurred over virtually identically located neighboring channels in both hemispheres. The part shaded in gray represents the regulation phase of 30 s duration.