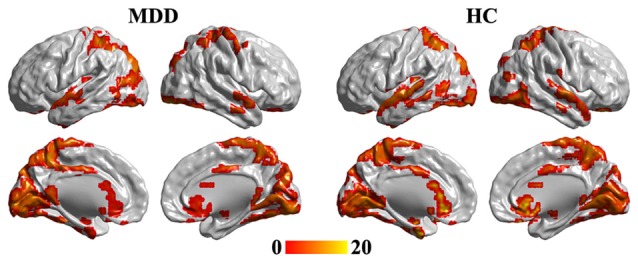
Figure 1.

One-tailed one-sample t-tests were used to identify the brain hub regions in MDD and HC. The significance was determined using false discovery rate (FDR) correction method with p < 0.05. The left panel is the hubs in MDD patients, and the right panel is the hubs in HC group. Color bar is the t value of one-sample t-test analysis. MDD, major depressive disorder; HC, healthy control.
