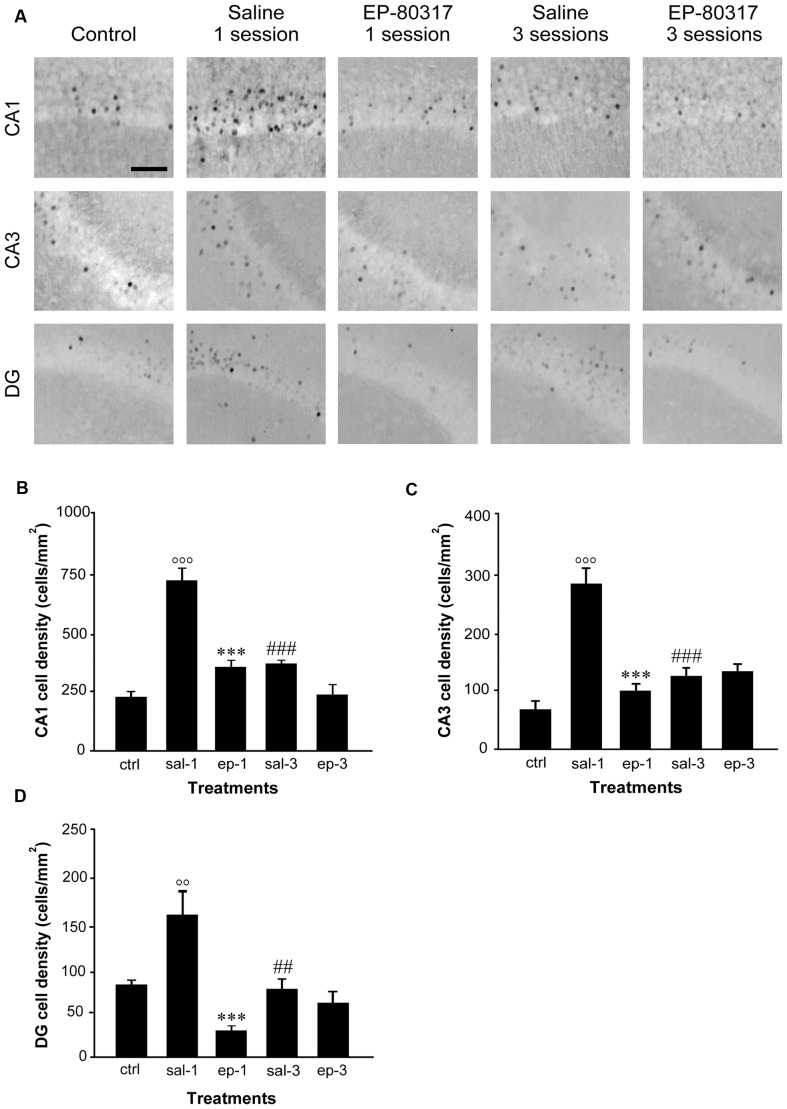
Figure 3.
FosB/ΔFosB immunoreactivity in hippocampal regions of mice treated with saline or EP-80317 and exposed to different sessions of 6-Hz corneal stimulation. In (A), FosB/ΔFosB immunoreactivity is illustrated in CA1, CA3, and dentate gyrus (DG), in a representative unstimulated control (ctrl) mouse. Besides, FosB/ΔFosB immunoreactivity is also shown in mice exposed to one or three different sessions of 6-Hz corneal stimulation, and pretreated with saline (sal) or EP-80317 (ep). Immunoreactivity was measured and results are illustrated in (B–D). Note that FosB/ΔFosB levels were significantly increased in CA1 (B), CA3 (C), and DG (D) after the first session, in saline-treated mice only (°°P < 0.01, °°°P < 0.001 vs. controls; Fisher’s least significant difference test). In EP-80317-treated mice, FosB/ΔFosB levels were instead maintained at basal values and were significantly different from saline-treated mice (***P < 0.001 vs. sal-1). Note also that FosB/ΔFosB levels were significantly reduced in the third session of saline-treated mice (##P < 0.01, ###P < 0.001 vs. sal-1). Scale bar, 50 μm.

