
FIGURE 9.
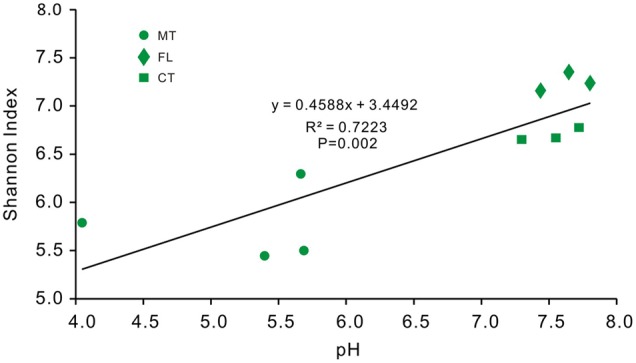
Regression analysis between bacterial OTU diversity and pH values from overlying soil samples of Heshang Cave. Sample colors are the same as previous figures, and abbreviations used are listed for Figure 1.
Official websites use .gov
A
.gov website belongs to an official
government organization in the United States.
Secure .gov websites use HTTPS
A lock (
) or https:// means you've safely
connected to the .gov website. Share sensitive
information only on official, secure websites.
Regression analysis between bacterial OTU diversity and pH values from overlying soil samples of Heshang Cave. Sample colors are the same as previous figures, and abbreviations used are listed for Figure 1.