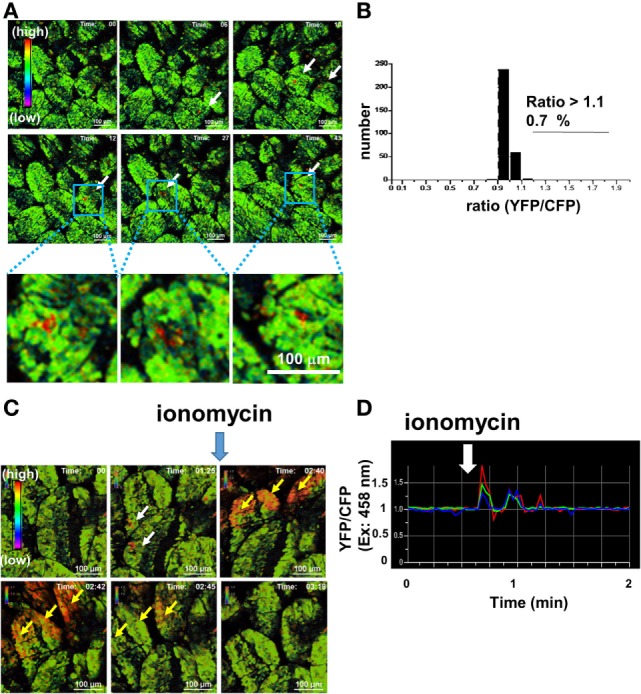
Figure 2.

Intravital Ca2+ signaling images mediated by ionomycin in the intestinal tract of a mouse under ubiquitous YC3.60 expression. (A) Representative Ca2+ signaling images in the intestinal tract of a mouse under ubiquitous YC3.60 expression without any stimulation. Ratiometric images [yellow fluorescent protein (YFP)/cyan fluorescent protein (CFP) at excitation of 458 nm] are shown. The rainbow parameter indicates relative Ca2+ concentration. (B) Distribution of time-integrated intracellular Ca2+ concentrations of randomly selected regions. N = 10; frame = 30. (C) Representative Ca2+ signaling images in the intestinal tract of a mouse under ubiquitous YC3.60 expression with ionomycin. Ratiometric images (YFP/CFP at excitation of 458 nm) are shown. Five micromolars of ionomycin in PBS were added at the indicated time point. A rainbow parameter indicates relative Ca2+ concentration; scale bar, 100 µm; frame = 85. (D) Ratiometric intensities (YFP/CFP at excitation of 458 nm) of indicated regions, represented by yellow arrows in (C) (n = 3), were measured for 2 min at 2-s intervals. Spontaneous Ca2+ signals are indicated by white arrows. Shown are representative results from two mice.
