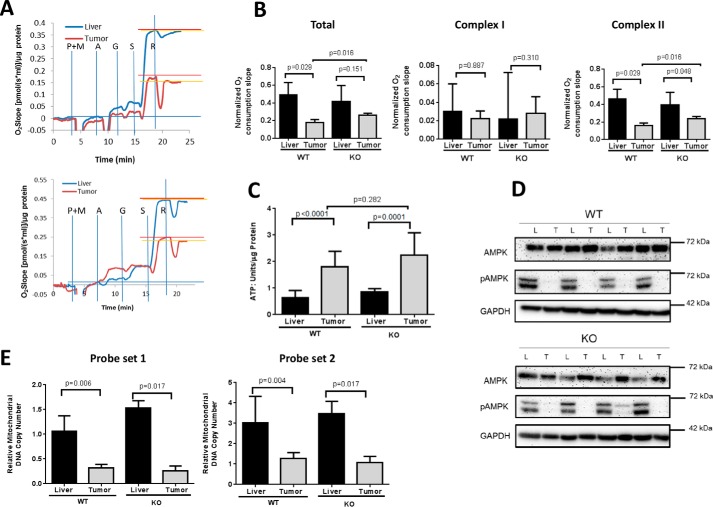
FIGURE 2.
Mitochondrial function in WT and KO livers and HBs. A, typical Oroboros Oxygraph 2k respirometer tracings in paired sets of WT (top) and KO (bottom) livers and tumors. Vertical blue lines indicate the points of addition of the Complex I substrates pyruvate (P), malate (M), and glutamine (G) and the Complex II substrate succinate (S). A = ADP; R = the Complex I inhibitor rotenone, the concentration of which had been previously titrated to provide maximal Complex I inhibition. The results depicted here were adjusted for differences in total protein levels. B, quantification of the results depicted in A. Each point represents total rates of oxygen consumption or the individual activities of Complex I or Complex II in response to their respective substrates. Total activity was calculated based on the spike in oxygen consumption following the addition of succinate. Complex II activity was derived by calculating the residual O2 consumption remaining after rotenone addition (horizontal orange lines in A). C, ATP levels. n = 4–5 samples/group. D, AMPK and phosphorylated AMPK (pAMPK) levels in tumors (T) and livers (L). Liver and tumor lysates, like those shown in in Fig. 1F, were assessed for total AMPK or its active (phospho-Thr172) form. GAPDH served as a control for protein loading. E, mitochondrial mass in livers and HBs. Two different probe sets (probe set 1 and probe set 2) were used to amplify mtDNA from two unique genomic regions using a TaqMan-based approach. mtDNA content was normalized to a nuclear DNA target that was amplified by a similar approach. n = 4–6 samples/group. Error bars indicate ± S.E.

