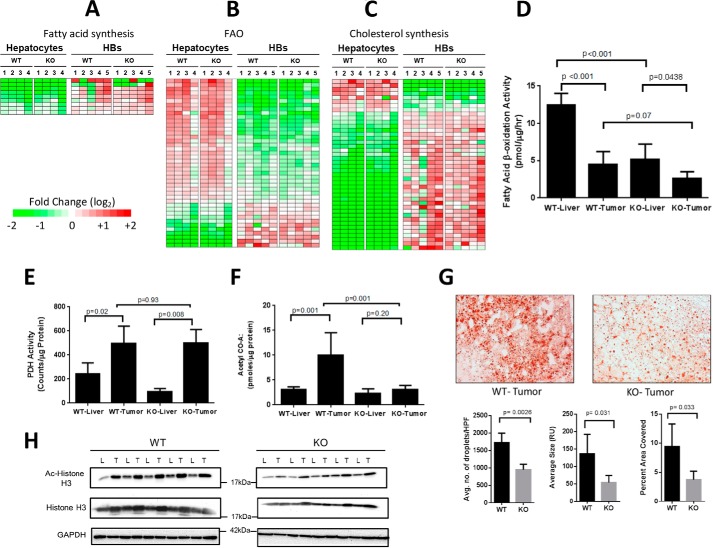
FIGURE 4.
Deregulation of pathways involving lipid and acetyl-CoA metabolism in WT and KO HBs. A–C, differential expression of transcripts related to fatty acid synthesis, FAO, and cholesterol synthesis in WT and KO hepatocytes and HBs. Non-overlapping sets of transcripts from the relevant IPAs depicted in supplemental Fig. S8 are shown as are additional members of these pathways (q > 0.05> p: see supplemental Figs. S9–S11 for absolute expression differences among the transcripts depicted here). D, β-oxidation of [3H]palmitate in WT and KO livers and tumors. E, PDH assays were performed in triplicate on four samples from each of the indicated groups. F, acetyl Co-A levels in WT and KO livers and tumors. The results represent the mean of at least five samples/group each performed in triplicate. G, Oil Red O staining showing typical examples of neutral lipid staining in WT and KO HBs. Histograms beneath the micrographs show quantification for lipid droplet number, size, and intracellular area composed of lipid in a series of sections compiled from five representative tumors from each group. H, immunoblots of representative WT and KO livers (L) and tumors (T) probed with anti-acetyl histone H3 (Lys-9/Lys-14) or anti-histone H3 antibodies. Calculations of the Ac-H3:Total H3 ratios in each sample showed them to be higher in WT tumors than in KO tumors after adjusting to total histone H3 (p = 0.038). Error bars indicate ± S.E.

