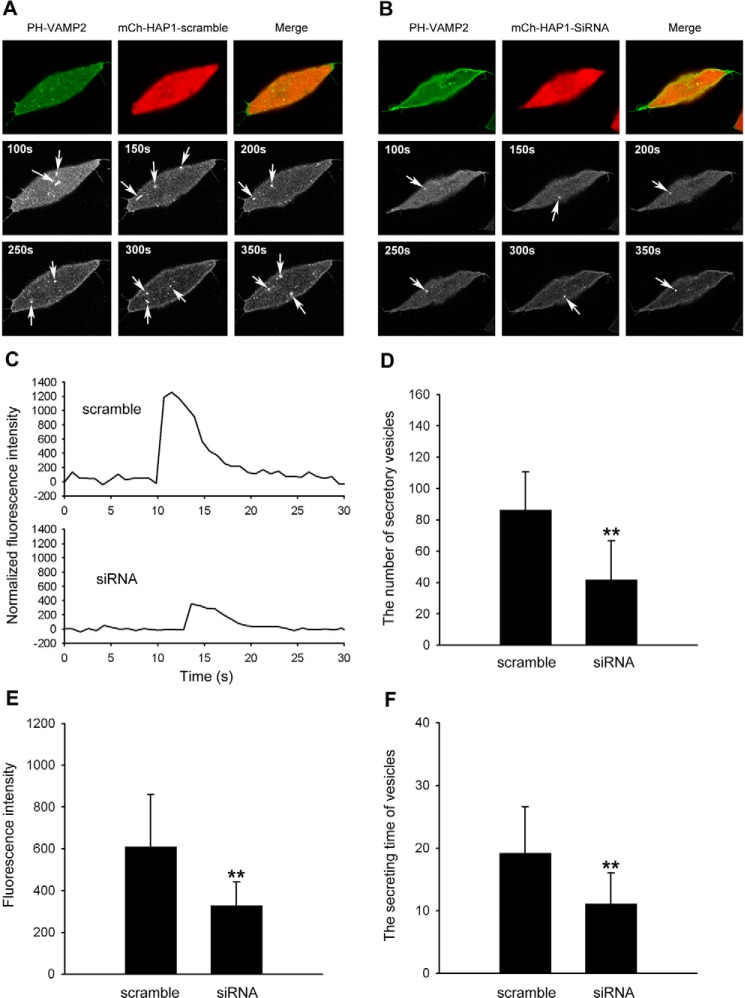
FIGURE 3.
Inhibiting Hap1 expression decreases the formation of secreted vesicles. A and B, visualization of secretory activities in INS-1 cells co-expressed PH-VAMP2 with mCh-Hap1-scramble or mCh-Hap1-siRNA. Confocal imaging at the cell footprint shows a number of fluorescent spots at PM that spread and are diffuse, which represent the secreting events. Sequential images of insulin-secreting events were observed in control cells after high K+ stimulation, whereas reduced releasing events were seen in Hap1-siRNA. Scale bar, 10 μm. C, representative time course of the fluorescence changes measured at the fluorescent spots (arrow) in scramble-siRNA and Hap1-siRNA cells. D, INS-1 cells treated with Hap1-siRNA displayed a significant reduction in insulin release number after high K+ stimulation for 300 s, compared with control cells. E, fluorescent intensity for insulin decreases in INS-1 cells treated with Hap1-siRNA. F, inhibiting Hap1 diminished the duration of insulin release from secreted vesicles (*, p < 0.05; **, p < 0.001; scramble n = 56, siRNA n = 48).

