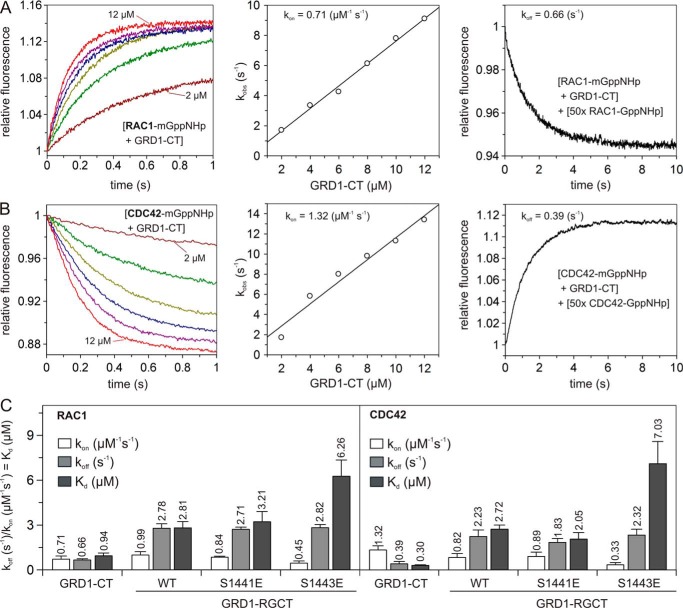
FIGURE 5.
Phosphomimetic mutation of RGCT and deletion of CT affect the IQGAP1 association with CDC42 and RAC1. A and B, individual rate constants for the GRD1-CT interaction with RAC1 and CDC42 are represented in A and B. Left panel, association of mGppNHp-bound RAC1 or CDC42 (0.2 μm, respectively) with increasing concentrations of GRD1-CT (2 to 12 μm). Middle panel, evaluated association rate constant (kon) from the plot of the kobs values, obtained from the exponential fits to the association data in the left panel against the corresponding concentrations of the GRD1-CT. Right panel, evaluated dissociation rate constant (koff) measured by the displacement of the GRD1-CT (2 μm) from its complex with mGppNHp-bound RAC1 or CDC42 (0.2 μm, respectively) in the presence of excess amounts of non-fluorescent RAC1-GppNHp (10 μm). Other kinetics are given in supplemental Figs. S1 and S2. C, calculated individual rate constants for the interaction of the IQGAP1 variants with RAC1 and CDC42, respectively, plotted as bar charts. Dissociation constants (Kd) were obtained from the ratio koff/kon. Data are expressed as the mean ± S.D. All kobs measurements experiments were accomplished in triplicate.

