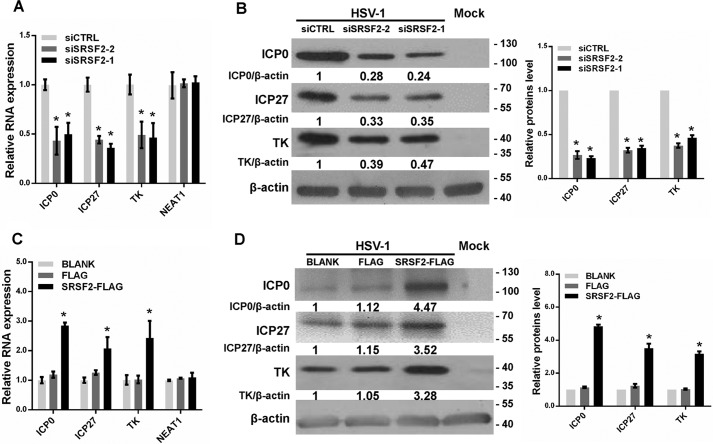
FIGURE 2.
SRSF2 regulated viral gene expression. A, after 36 h of transfection with the SRSF2 siRNA or negative control siRNA, HeLa cells were infected with HSV-1 at a m.o.i. of 1 for 4 h. The ICP0, ICP27, and TK expression levels relative to β-actin expression were determined with qRT-PCR in three independent experiments. An unrelated RNA (NEAT1) was used as the control. The data are presented as the mean ± S.D. (*, p < 0.01, Student's t test). B, after 36 h of transfection with the SRSF2 siRNA or negative control siRNA, HeLa cells were infected with HSV-1 at a m.o.i. of 1 for 8 h. The ICP0, ICP27, and TK expression levels were measured with Western blotting. Protein ratios of the indicated proteins/β-actin were analyzed with ImageJ software, and statistical analysis was conducted with data from three independent experiments (right panel). The data are presented as the mean ± S.D. (*, p < 0.01, Student's t test). C, after 36 h of transfection with SRSF2-FLAG, FLAG, or BLANK, HeLa cells were infected with HSV-1 at a m.o.i. of 1 for 4 h. The ICP0, ICP27, and TK expression levels relative to β-actin expression were determined by qRT-PCR for three independent experiments. An unrelated RNA (NEAT1) was used as the control. The data are presented as the mean ± S.D. (*, p < 0.01, Student's t test). D, after 36 h of transfection with SRSF2-FLAG, FLAG, or BLANK, HeLa cells were infected with HSV-1 at a m.o.i. of 1 for 8 h. The ICP0, ICP27, and TK expression levels were measured with Western blotting. Protein ratios of the indicated proteins/β-actin were analyzed with ImageJ software, and statistical analysis was conducted with data from three independent experiments (right panel). The data are presented as the mean ± S.D. (*p < 0.01, Student's t test).

