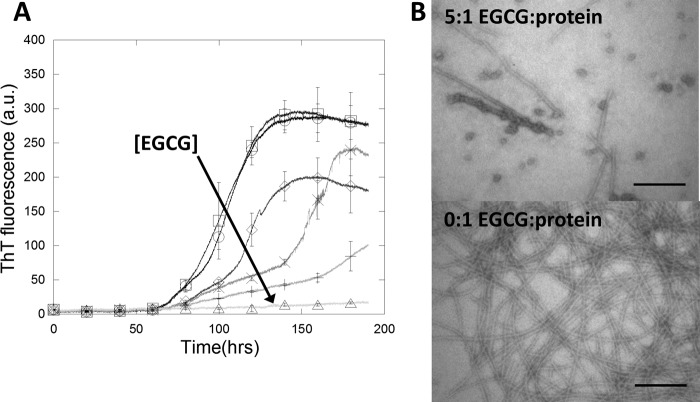
FIGURE 3.
EGCG inhibits FapC fibrillation. A, protein fibrillation of 0.5 mg/ml (≈15 μm) recombinant FapC in the presence of 40 μm ThT in PBS with 1% DMSO. ThT fluorescence increases markedly when binding to amyloids. Increasing EGCG:FapC molar ratio is indicated by lighter gray scale and ○ (0:1), □ (0.2:1), ♢ (0.5:1), × (1:1), + (2:1), and ▵ (5:1). The direction of the arrow indicates higher EGCG concentration. Error bars denote S.D. (n = 3) and are shown for every 20 hour data point. B, TEM images of samples with or without a 5:1 molar ratio of EGCG:FapC monomer. Scale bars, 200 nm. a.u., arbitrary units.

