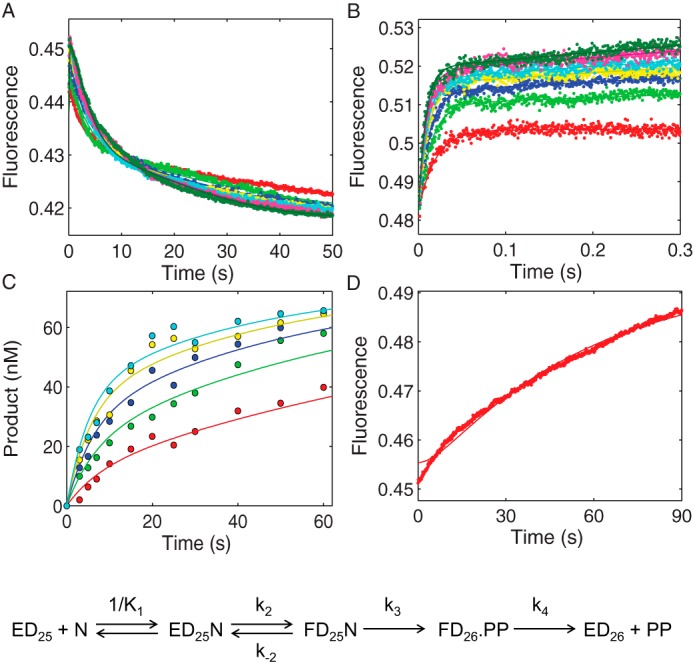
FIGURE 6.

Kinetic characterization of MDCC-labeled HIVRT R72A mutant by global analysis of TTP binding, incorporation, and PPi release. A, the time dependence of the fluorescence change during TTP incorporation was monitored after mixing various concentrations of TTP (5, 10, 20, 30, 40, 60, 80, 100, and 150 μm) with a preformed enzyme·DNA/RNA complex (100 nm MDCC-labeled HIVRT_R72A and 150 nm d25/r45). B, TTP-induced conformational change was measured with dideoxy-terminated primer to prohibit the chemistry step. Various concentrations of TTP (20, 30, 40, 60, 80, 100, 150, and 200 μm) were mixed with a preformed enzyme·DNAdd/RNA complex (100 nm MDCC-labeled HIVRT_R72A and 150 nm d25ddA/r45). C, the concentration dependence of TTP incorporation was measured using the manual quench method. Various concentrations of TTP (5, 12.5, 25, 50, and 100 μm) were mixed with a preformed enzyme·DNA/RNA complex (175 nm MDCC-labeled HIVRT_R72A and 75 nm d25/r45). D, rate of PPi release during TTP incorporation was monitored by rapidly mixing 25 μm TTP with a preformed enzyme·DNA/RNA complex (150 nm MDCC-labeled HIVRT_R72A and 100 nm d25/r45) in the presence of 1.5 μm MDCC-PBP and 0.6 μm pyrophosphatase. Fluorescence was observed by excitation of MDCC at 425 nm and monitoring emission with a 475-nm band-pass filter with a 50-nm bandwidth. Global data analysis of all four experiments was performed to derive rate constants governing TTP binding and incorporation. The TTP ground-state binding constant (1/K1) was determined as 92 ± 3 μm. The forward (k2) and reverse (k−2) rates for the conformational change were 127 ± 2 and 32 ± 1 s−1, which defined a K2 value of 4 ± 0.2 that was 170-fold smaller than that of WT HIVRT-MDCC (690 ± 67) (35). Rates of chemistry and PPi release were determined as 0.18 ± 0.003 and 0.04 ± 0.008 s−1, respectively.
