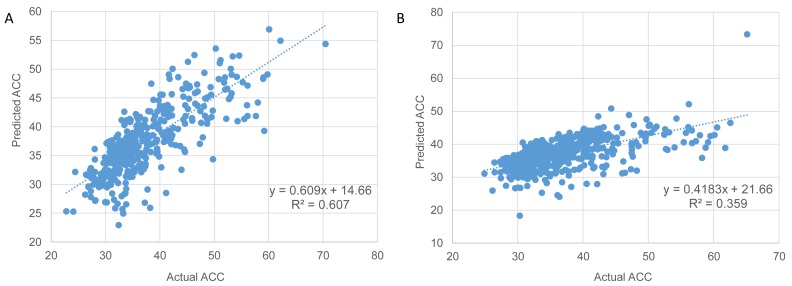
Figure 6.
Prediction of protein solvent accessibility for proteins with known structures in E. coli (A) and H. sapiens (B). The plot of multiple linear regression (MLR) predictions versus the actual ACC estimations based on the known structural data of the proteins. Spearman correlation (R2 values) is 0.602 in E. coli (A) and 0.4 in human (B). The actual ACC values were estimated from known protein structures by extraction of the relative solvent accessibility (RSA) of each side chain residues. A protein solvent accessibility is computed as the mean RSA over all residues (see Materials and Methods). Values of predicted average solvent accessibility were estimated using a MLR model including the following mRNA features: (i) size (log) − the length of the coding region (P-values < 0.005), (ii) ΔGmin, free energy of mRNA folding (P-values < 0.005) and (iii) dS (log), synonymous evolutionary rate, which was estimated for E. coli versus S. typhi (A) and human vs mouse (B) orthologous gene pairs (P-values < 0.05). All three features significantly contribute to the model (P values show above); their coefficients are significantly different from 0.

