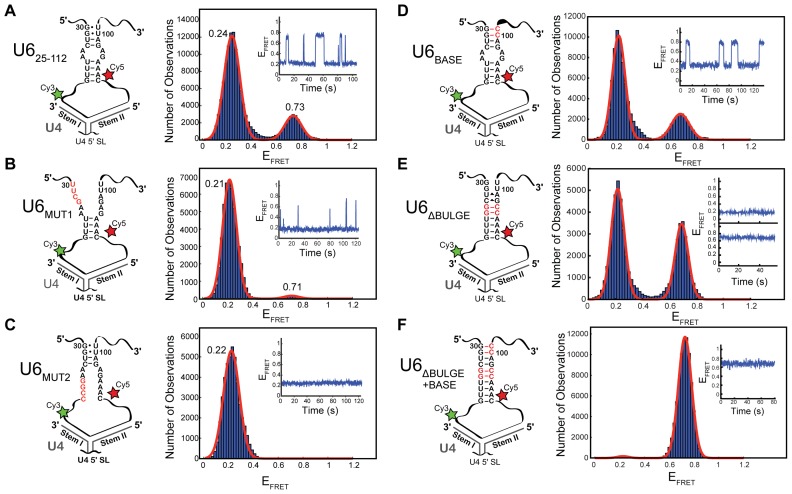
Figure 2.
Alteration of telestem base-pairing also alters U6 smFRET dynamics in U4/U6. Each panel has at left a cartoon of the U41-64/U625-112 di-RNA used for the experiment, including any mutations in the U6 telestem (in red) and a histogram of EFRET values obtained from single molecules at right. (A) U41-64/U625-112 di-RNA without any mutations (N = 213). The distribution could be fit to a sum of two Gaussian functions centered at 0.24 ± 0.01 and 0.73 ± 0.01 (red line). Dynamics consistent with a reversible two-state conformational transition were apparent in single molecule EFRET time trajectories (inset). (B) U41-64/U6MUT1 (N = 102). The distribution could be fit to a sum of two Gaussian functions centered at 0.22 ± 0.01 and 0.71 ± 0.04 (red line). Single molecule EFRET time trajectories showed transient excursions to the short-lived 0.71 EFRET state (inset). (C) U41-64/U6MUT2 (N = 104). The distribution could be fit to a single Gaussian function centered at 0.22 ± 0.01 (red line). No dynamics were observed in single molecule EFRET time trajectories (inset). (D) U41-64/U6BASE (N = 114). The distribution could be fit to a sum of two Gaussian functions centered at 0.23 ± 0.01 and 0.69 ± 0.01 (red line). Dynamics consistent with a reversible two-state conformational transition were apparent in single molecule EFRET time trajectories (inset). (E) U41-64/U6ΔBULGE (N = 126). The distribution could be fit to a sum of two Gaussian functions centered at 0.22 ± 0.01 and 0.69 ± 0.01 (red line). Static ∼0.2 and ∼0.7 states were observed (inset). (F) U41-64/U6BASE + ΔBULGE (N = 114). The distribution could be fit to a sum of two Gaussian functions centered at 0.23 ± 0.05 and 0.73 ± 0.01 (red line). Example of a single molecule EFRET time trajectories showing no excursions from the 0.7 EFRET state (inset). Data in (A–F) were collected in imaging buffer with 400 mM NaCl (see ‘Materials and Methods’ section), and molecules showing a constant high EFRET of ∼0.95 consistent with the absence of U4 were not included in these histogram analyses.

