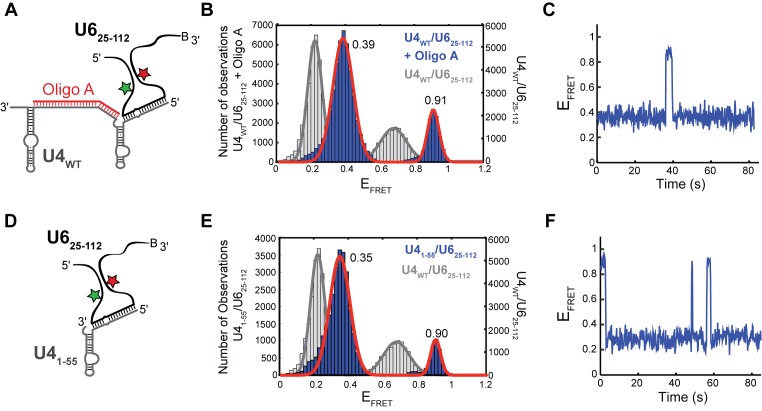
Figure 5.
Destabilization of U4/U6 stem I changes U6 smFRET dynamics. (A) Cartoon of the oligonucleotide A/U4WT/U625-112 ternary complex used for smFRET experiments showing disruption of stem I by oligonucleotide A. (B) Histogram of EFRET values obtained from single molecules of oligonucleotide A/U4WT/U625-112 (N = 172, blue) overlaid with the distribution obtained from single molecules of U4WT/U625-112 (Figure 1D, gray). The distribution could be fit to a sum of two Gaussian functions centered at, 0.39 ± 0.01 and 0.91 ± 0.01 (red line). (C) Single molecule EFRET time trajectories predominantly showed reversible excursions between the 0.39 and 0.90 EFRET states. (D) Cartoon of the U41-55/U625-112 di-RNA complex that lacks stem I used for smFRET experiments. (E) Histogram of EFRET values obtained from single molecules of U41-55/U625-112 (N = 105, blue) overlaid with the distribution obtained from single molecules of U4WT/U625-112 (Figure 1D, gray). The distribution could be fit to a sum of two Gaussian functions centered at 0.35 ± 0.01 and 0.90 ± 0.01 (red line). (F) Single molecule EFRET time trajectories predominantly showed reversible excursions between the 0.35 and 0.90 EFRET states. Data in (B, C, E and F) were acquired in imaging buffer with 400 mM NaCl (see ‘Materials and Methods’ section), and molecules showing a constant high EFRET of ∼0.95 consistent with the absence of U4 were not included in these histogram analyses.

