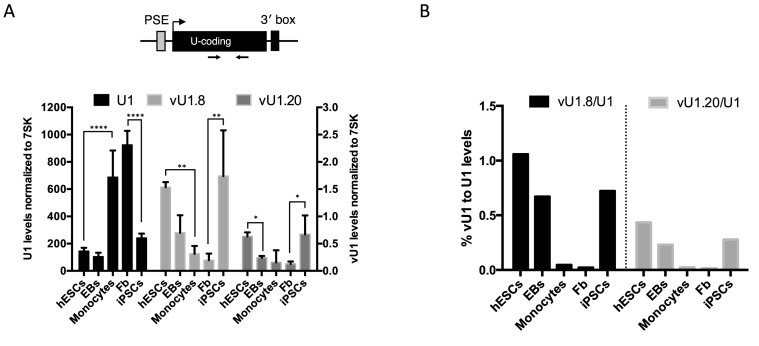
Figure 2.
vU1 and U1 genes follow reciprocal patterns of expression during differentiation and cell re-programming. (A) qRT-PCR analysis of steady state U1, vU1.8 and vU1.20 levels in human ESCs, EBs, ESC-derived monocytes, human skin fibroblasts and fibroblasts-derived iPSCs. Primers used are illustrated in the schematic above the graph. U1/vU1 levels were estimated using a genomic (g)DNA as standard and normalized to 7SK levels across the different cell types. U1 levels are indicated on the Y-axis to the left of the graph and vU1 levels on the right Y-axis. Error bars represent SEM of three independent differentiation/re-programming experiments (Two-way ANOVA analysis (U1); **** = P < 0.0001 and one-way ANOVA (vU1.8 +vU1.20); ** = P < 0.01, *P = 0.05. (B) The ratio of vU1 to U1 levels, expressed as a percentage of U1 levels, across the different cell types.

