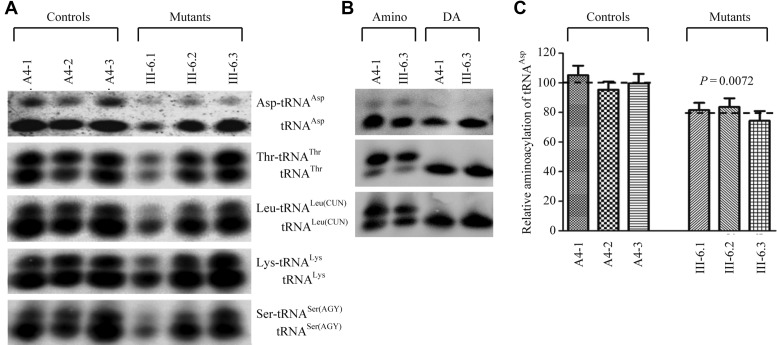
Figure 3.
In vivo aminoacylation assays. (A) Two micrograms of total mitochondrial RNA purified from six cell lines under acid conditions were electrophoresed at 4°C through an acid (pH 3.0) 10% polyacrylamide-7 M urea gel, electroblotted and hybridized with a DIG-labeled oligonucleotide probe specific for the mt–tRNAAsp. The blots were then stripped and rehybridized with mt–tRNAThr, mt–tRNALeu(CUN), mt–tRNALys and mt–tRNASer(AGY), respectively. (B) The samples from one control (A4.1) and mutant (III-6.3) cell lines were deacylated (DA) by heating for 10 min at 60°C at pH.8.3 and electrophoresed as above. Aminoacylation assays for mt–tRNAAsp were carried out in parallel for aminoacylated and deacylated samples. (C) In vivo aminoacylated proportions of mt–tRNAAsp in the mutant and controls. The calculations were based on three independent determinations. Graph details and symbols are explained in the legend to the Figure 2.

