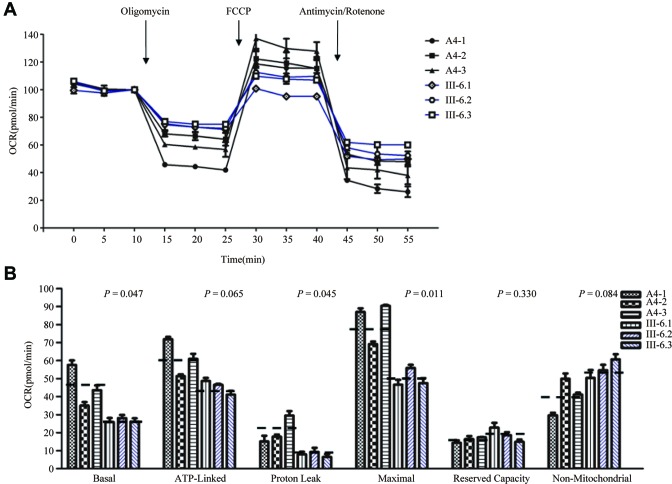
Figure 5.
Respiration assays. (A) An analysis of O2 consumption in the various cell lines using different inhibitors. The rates of O2 (OCR) were first measured on 2 × 10⁴ cells of each cell line under basal condition and then sequentially added to oligomycin (1.5 μM), carbonyl cyanide p-(trifluoromethoxy) phenylhydrazone (FCCP) (0.5 μM), rotenone (1 μM) and antimycin A (1 μM) at indicated times to determine different parameters of mitochondrial functions. (B) Graphs presented the ATP-linked OCR, proton leak OCR, maximal OCR, reserve capacity and non-mitochondrial OCR in mutant and control cell lines. Non-mitochondrial OCR was determined as the OCR after rotenone/antimycin A treatment. Basal OCR was determined as OCR before oligomycin minus OCR after rotenone/antimycin A. ATP-lined OCR was determined as OCR before oligomycin minus OCR after oligomycin. Proton leak was determined as Basal OCR minus ATP-linked OCR. Maximal was determined as the OCR after FCCP minus non-mitochondrial OCR. Reserve Capacity was defined as the difference between Maximal OCR after FCCP minus Basal OCR. The average of 4 determinations for each cell line is shown, the horizontal dashed lines represent the average value for each group. Graph details and symbols are explained in the legend to Figure 2.

