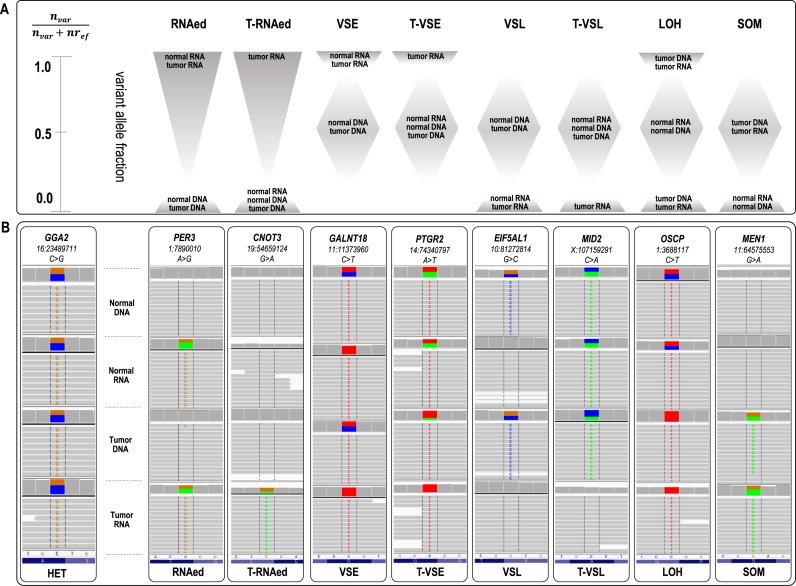
Figure 1.
(A) Schematic representation of allelic asymmetries across normal and tumor RNA and DNA datasets, corresponding to eight nucleotide events. An estimation of the range of the variant allele fraction for each of the events is represented through shaded areas. Briefly, loci classified as RNAed have an R>0 exclusively in the RNA sets; for T-RNAed, R > 0 is confined to the tumor RNA sets only. VSE and VSL have 0 < R < 1 in the DNA sets, while R ∼ 1 or 0 in the RNA sets. When the latter applies exclusively to the tumor RNA, the asymmetry matches T-VSE or T-VSL events, respectively. In the case of LOH, the tumor datasets show an R ∼ 0 or 1, and for SOM R = 0 in the normal datasets while R>0 in the tumor sets. (B) IGV visualization of examples of SNVs associated with each of the eight events. The gene and position are shown on the top of each IGV panel. The variant nucleotide is positioned at the middle. The grey lines represent sequencing reads, and the colored letters show differences from the reference sequence. The colored blocks at the top (middle) of each of the four sub-panels depict the quantitative ratio between the variance and reference reads (color-coded); grey at this position indicates a lack of reads bearing the variant nucleotide.

