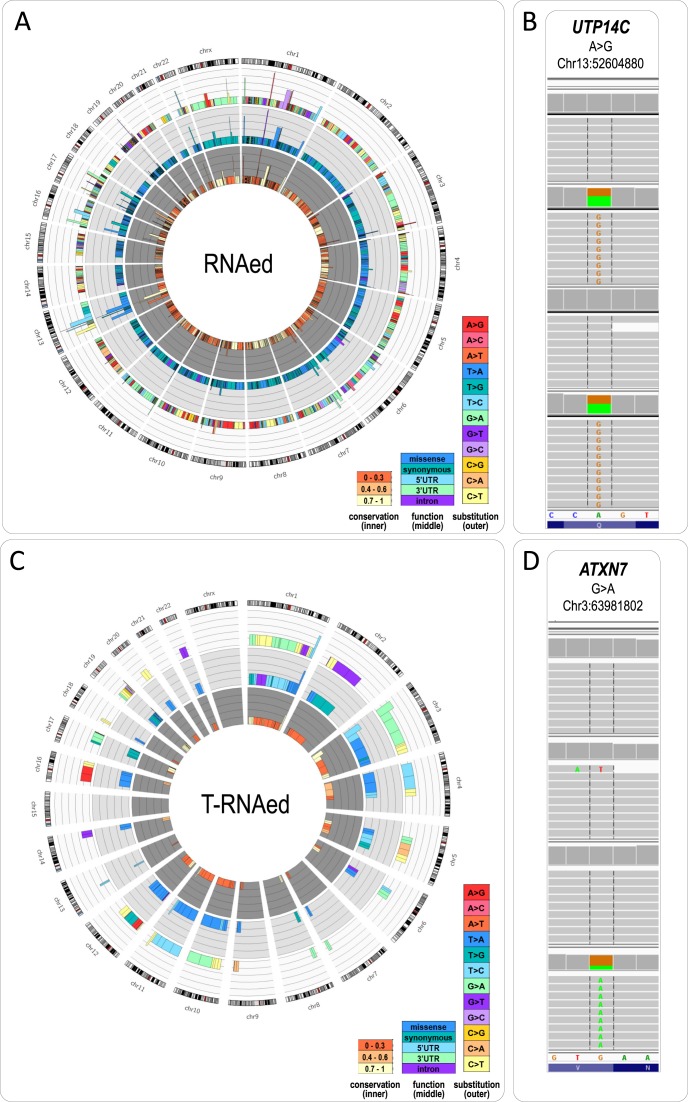
Figure 3.
(A) Circos plot of the variants matching the read distribution requirements for RNA editing across the 90 studied samples. The size of the peak corresponds to the number of samples (n) in which the variant was called (cut-off 1.5 after log10(n + 1)). Positions commonly assigned as RNAed are seen on chromosomes 3, 13, 16, 17, 22 and X. The outer layer displays a color scheme of the type of nucleotide substitution—C>T (light yellow) and A>G (pink) dominate over the rest of the changes. The central plot shows the substitution type (synonymous—teal, missense—blue), and the inner plot depicts the conservation score for the position (low—light yellow, medium—orange, high—dark orange). (B) IGV visualization of the most commonly called RNAed variant in the dataset (A>G at chr13:52604880 in UTP14C). (C) Circos plot of the variants matching the read distribution for T-RNAed across the 90 studied samples. The plots (from inner-to-outer) follow exactly the legend of (A). (D) IGV visualization of a novel variant called as T-RNAed—G>A at chr3:63981802 in ATXN7.

