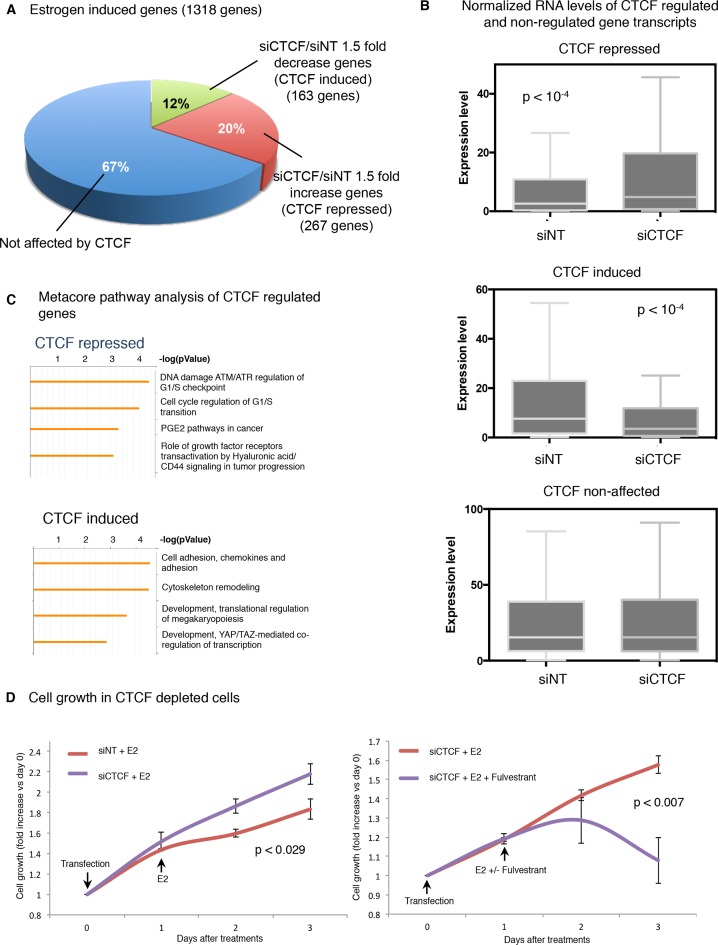
Figure 6.
CTCF modulates the expression of a subset of estrogen-induced genes. (A) MCF-7 cells were transfected with siControl or siCTCF, treated with estrogen and RNA was sequenced. We used 1318 estrogen-induced genes at 40 min and published previously (1) to calculate expression levels for each gene induced by estrogen in cells depleted or expressing CTCF (RKPM). Then we measured the fold change (FC) expression (siCTCF/siNT) and determined the fraction of genes with an 1.5 FC increase or decrease. (B) Box plot of normalized RNA levels of CTCF regulated genes (with at least 1.5 FC) or non-regulated genes. (C) Metacore pathway analysis of CTCF repressed or CTCF induced genes. (D) In siControl or siCTCF transfected MCF-7 cells, cell growth was measured when cells were stimulated with E2 (100 nM) and/or with Fulvestrant (1 μM). The data are the mean of six independent replicates ± s.d.

