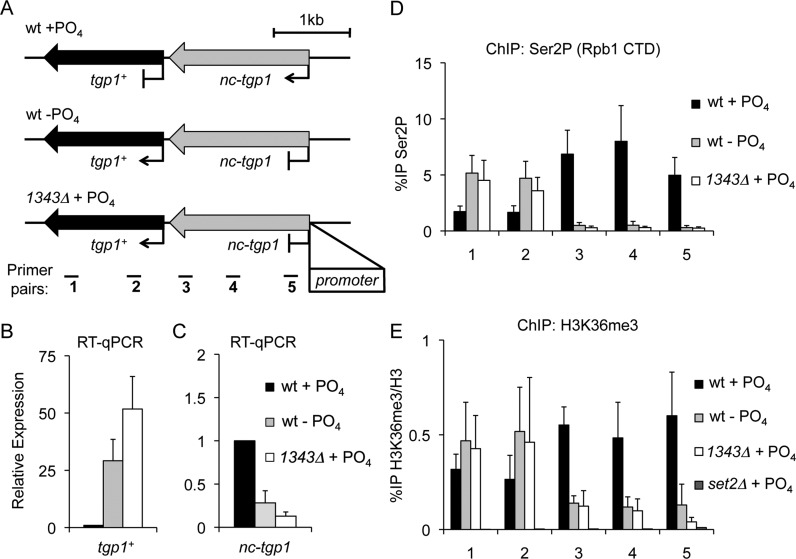
Figure 1.
nc-tgp1 transcription increases H3K36me3 levels over the tgp1+ promoter. (A) Schematic representation of the tgp1+ locus, including the nc-tgp1 lncRNA gene located immediately upstream. In phosphate-rich conditions (+PO4) the tgp1+ gene is repressed by nc-tgp1 transcription into the tgp1+ promoter. In contrast, reduced nc-tgp1 transcription, in response to phosphate starvation (−PO4) or following deletion of the nc-tgp1 promoter (1343Δ), permits tgp1+ induction (34). Primer pairs spaced over the tgp1+ locus are displayed below. (B and C) RT-qPCR analysis of tgp1+ mRNA levels (primer pair 1) and upstream nc-tgp1 lncRNA levels (primer pair 5) in wild-type cells grown in the presence or absence of phosphate, as well as in phosphate-replete1343Δ cells. (D) ChIP-qPCR analysis of the Ser2P form of elongating RNAPII over the tgp1+ locus in response to changes in phosphate availability/nc-tgp1 transcription. (E) ChIP-qPCR analysis of H3K36me3 over the tgp1+ locus in response to changes in phosphate availability/nc-tgp1 transcription. Error bars represent standard deviation resulting from at least three independent experiments.

