Figure 3.
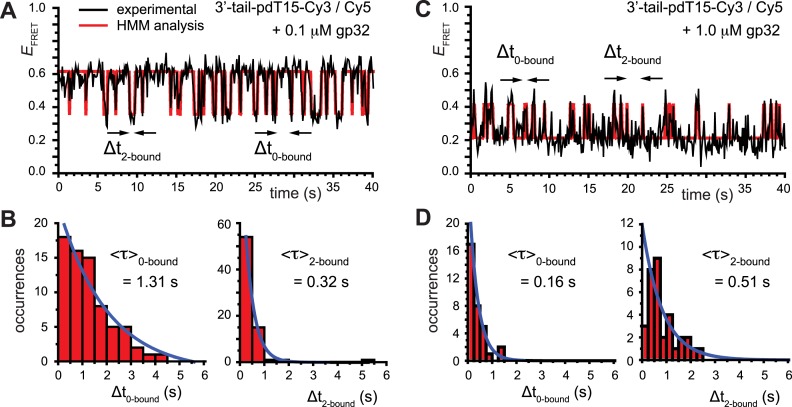
smFRET trajectories with hidden Markov model (HMM) analysis. (A) Representative smFRET trajectory (shown in black) of the p/t DNA construct 3′-tail-pdT15-Cy3/Cy5 in the presence of 0.1 μM gp32 superimposed onto an HMM derived idealized FRET trajectory (shown in red). The HMM analysis shows that these data are consistent with a two-state interpretation in which the system fluctuates between a doubly bound state (2-bound) and an unbound state (0-bound). (B) Representative histograms are shown for the persistence times,  and
and  , which were obtained from the HMM analysis. Histograms were constructed from ∼5000 transitions from ∼50 individual single molecule trajectories of 120-s duration. Average lifetimes
  = 1.31 s and
  = 0.32 s were calculated from single exponential fits to these histograms, which correspond to the apparent equilibrium constant
  = [2-bound]/[0-bound] = 0.24. (C and D) Same as for panels (A) and (B), except that the gp32 protein concentration was 1.0 μM. Under these conditions, the values of the average lifetimes and apparent equilibrium constant are
  = 0.16 s,
  = 0.51 s, and
  = 3.2.

