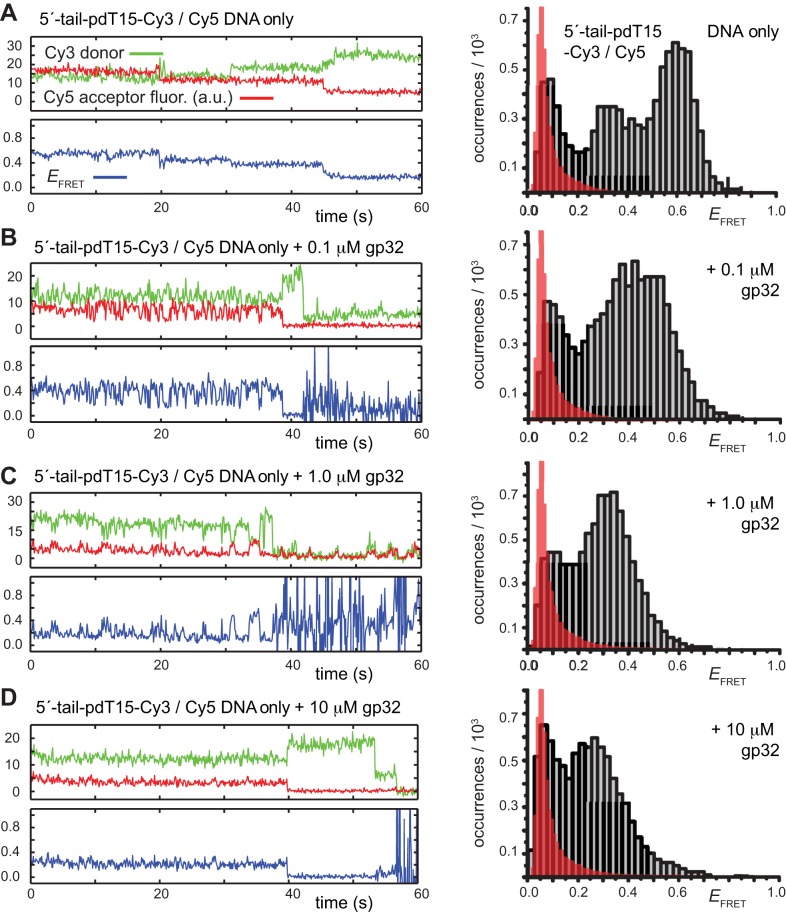
Figure 9.
Representative smFRET trajectories of the 5′-tail-pdT15-Cy3/Cy5 p/t DNA substrate at various gp32 concentrations. (A) p/t DNA substrates alone; (B) in the presence of 0.1 μM gp32; (C) 1.0-μM gp32; and (D) 10 μM gp32. Histograms of the smFRET efficiencies [ = IA/(ID + IA)], which are based on the compilation of thousands of individual smFRET trajectories, are shown in the right column. The trajectory for the DNA substrate alone [shown in Panel (A)] exhibits slow fluctuations between a high-FRET state centered at 0.6 and a low-FRET state centered at 0.35. The red-shaded regions in the histograms show the probability distribution of background signals, which was determined from control measurements performed using biotin-Cy3 samples (see Supplementary Data). The buffer solution in this figure and the next contained 100 mM NaCl, 6 mM MgCl2 and 10 mM Tris (pH 8.0).

