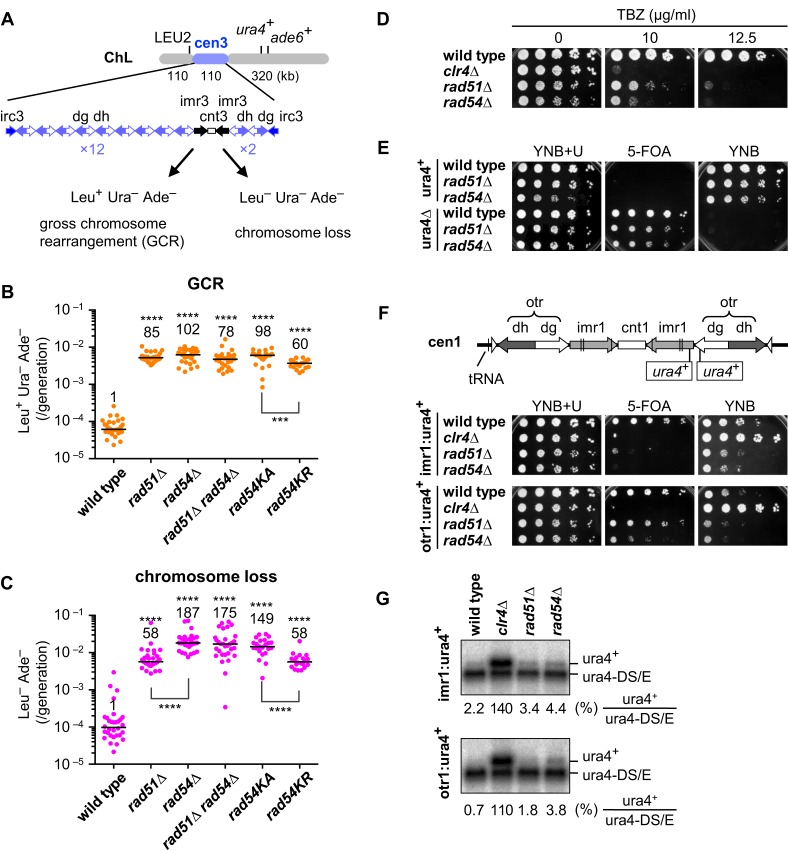
Figure 1.
Rad51 and Rad54 suppress gross chromosome rearrangements and are important for the structure and function of centromeres. (A) Illustrated are DNA repeats in centromere 3 (cen3) and three genetic markers introduced into ChL (16). GCRs associated with the loss of ura4+ and ade6+ result in Leu+ Ura– Ade–, whereas complete loss of ChL results in Leu– Ura– Ade–. Spontaneous rates of (B) GCRs and (C) chromosome loss were determined in wild-type, rad51Δ, rad54Δ, rad51Δ rad54Δ, rad54KA and rad54KR strains (TNF3896, 4034, 4048, 4942, 4599 and 4563, respectively). Independent experimental values are shown in scatter plots. Lines indicate medians. Rates relative to wild-type value are indicated at the top of each column. P-values were determined by the two-tailed Mann–Whitney test. ***P < 0.001; ****P < 0.0001. (D) Exponentially growing cells of wild-type, clr4Δ, rad51Δ and rad54 strains (TNF2399, 2803, 2621 and 3284, respectively) in EMM+U were 5-fold serially diluted with distilled water and spotted onto YE+U supplemented with thiabendazole (TBZ) at the indicated concentrations. (E) Wild-type, rad51Δ and rad54Δ cells of ura4+ (TNF35, 2610 and 3719, respectively), and those of ura4Δ (TNF2347, 2404 and 5015, respectively) were grown in EMM+U and spotted onto the indicated plates. (F) Illustrated are the integration sites of ura4+ in imr1 and otr1 (96). Wild-type, clr4Δ, rad51Δ and rad54Δ cells that contain imr1:ura4+ (TNF2399, 2803, 2621 and 3284, respectively), and those containing otr1:ura4+ (TNF2648, 2900, 2848 and 3273, respectively) grown in EMM+U were spotted onto the indicated plates. Cells were grown at 30°C. (G) Northern blot analysis of ura4+ and ura4DS/E RNAs in wild-type, clr4Δ, rad51Δ and rad54Δ cells. % of ura4+ RNAs compared to ura4-DS/E RNAs is shown below each panel.

