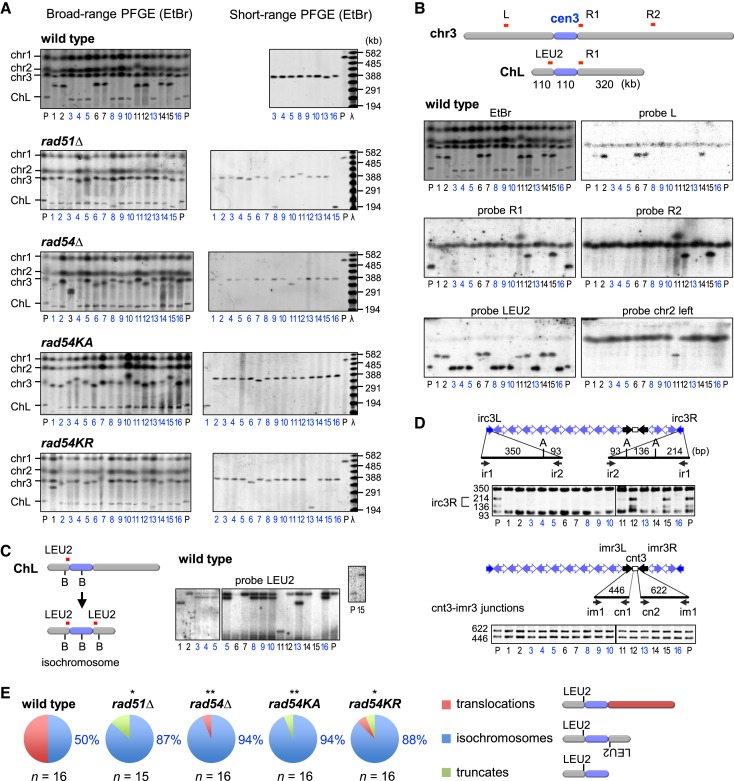
Figure 2.
Rad51 and Rad54 suppress isochromosome formation in the centromere. (A) Pulse field gel electrophoresis (PFGE) analysis of gross chromosome rearrangements (GCR) products. Chromosomal DNA were separated by broad-range PFGE (left panel) and short-range PFGE (right panel) (see Materials and Methods). Sizes of λ ladders (ProMega-Markers) are indicated on the right. GCR products smaller than the parental ChL are labeled in blue. P, parental. (B) Southern blotting of wild-type GCR products. DNA was transferred to a nylon membrane and hybridized with the indicated probes. (C) Chromosomal DNA was digested with BmgBI, loaded onto a 0.6% agarose gel, separated by PFGE (switching time 1 to 6 s, 6 V/cm for 22 h) in 0.5x TBE buffer, and subjected to Southern hybridization using LEU2 probe. B, BmgBI. (D) PCR analysis of GCR products. ChLs recovered from agarose gel were used as templates for PCR. irc3L and irc3R regions were amplified, treated with ApoI and separated by standard agarose gel electrophoresis (upper panels). cnt3-imr3 junctions were also amplified (lower panels). Primer sequences are shown in Supplementary Table S2. A, ApoI. (E) Pie charts show the distribution of translocations, isochromosomes and truncates in each strain. The proportion of isochromosomes is indicated. Numbers of isochromosomes and others were compared between wild-type and mutant strains with the two-tailed Fisher's exact test. *P < 0.05; **P < 0.01.

